This post will compile QEEG surface z-score maps from three sources, for purposes of demonstrating substantial agreement between different databases and methods:
NeuroGuide report
BrainDX report generator (RG)
BrainAvatar BrainDX DLL live snapshots
It will be demonstrated that these three methods produce comparable results, in particular that the live maps using BrainAvatar and the BrainDX DLL provide consistent and accurate results.This post will compile QEEG surface z-score maps from three sources:
NeuroGuide report
BrainDX report
BrainAvatar BrainDX DLL live snapshots. More than one snapshot may be shown, because these are constantly changing “live” maps
It will be demonstrated that these three methods produce comparable results, in particular that the live maps using BrainAvatar and the BrainDX DLL provide consistent and accurate results.
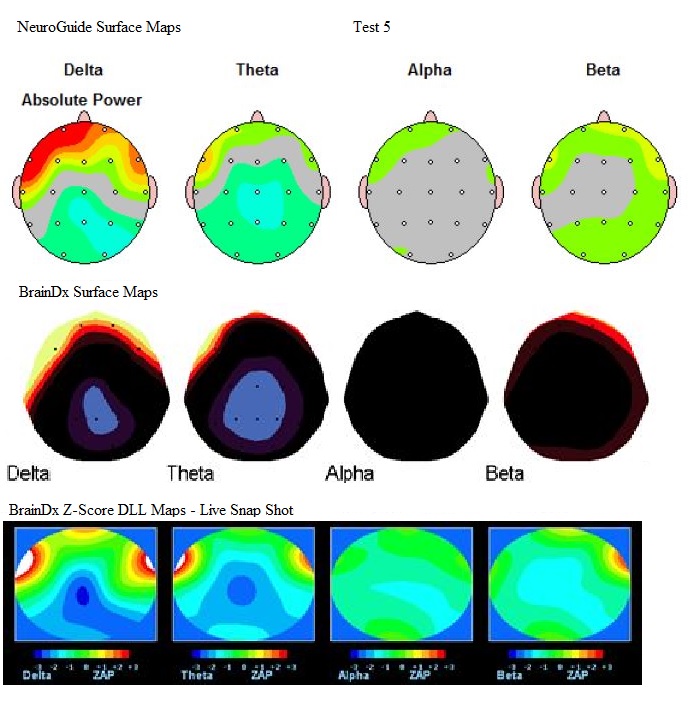
Example 1 shows similar deviations in limited frontal and posterior delta excess, significant diffuse frontocentral theta excess, normal alpha, and a slight posterior beta deficit.
.jpg)
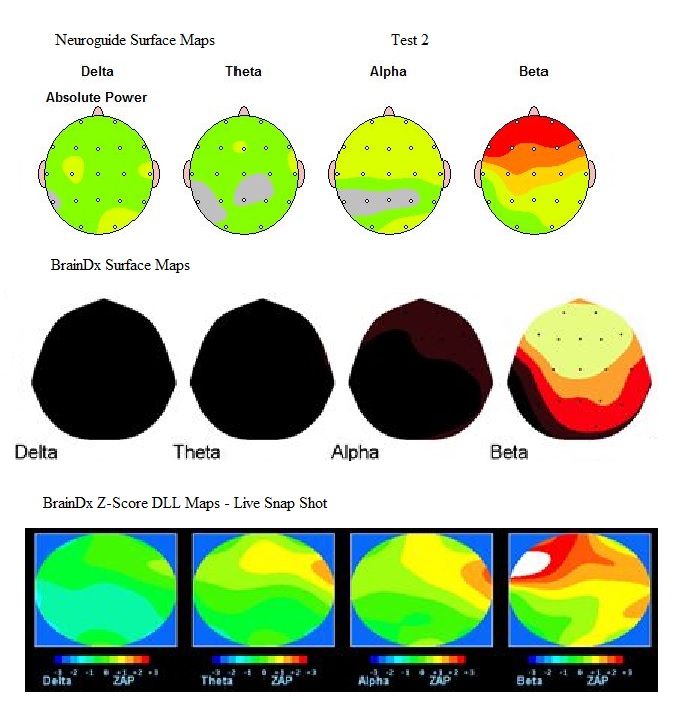
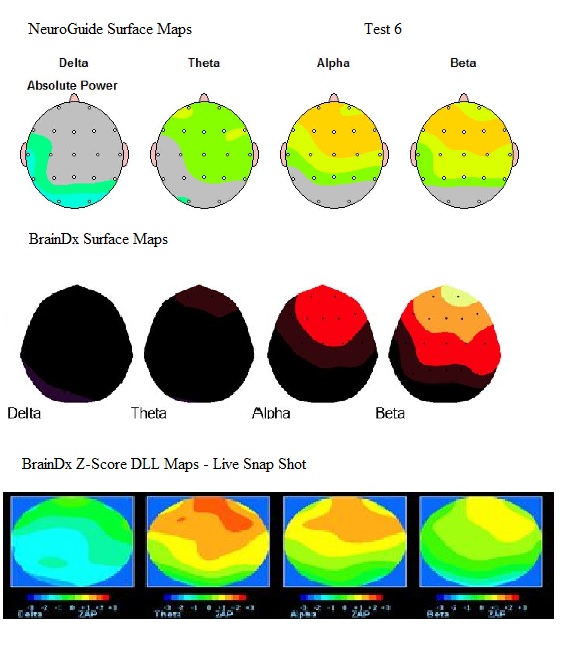
Example 2 shows moderate diffuse delta excess especially in left central and right temporal, slight diffuse right frontocentral theta excess, moderate diffuse right frontocentral alpha excess, and significant frontal beta excess
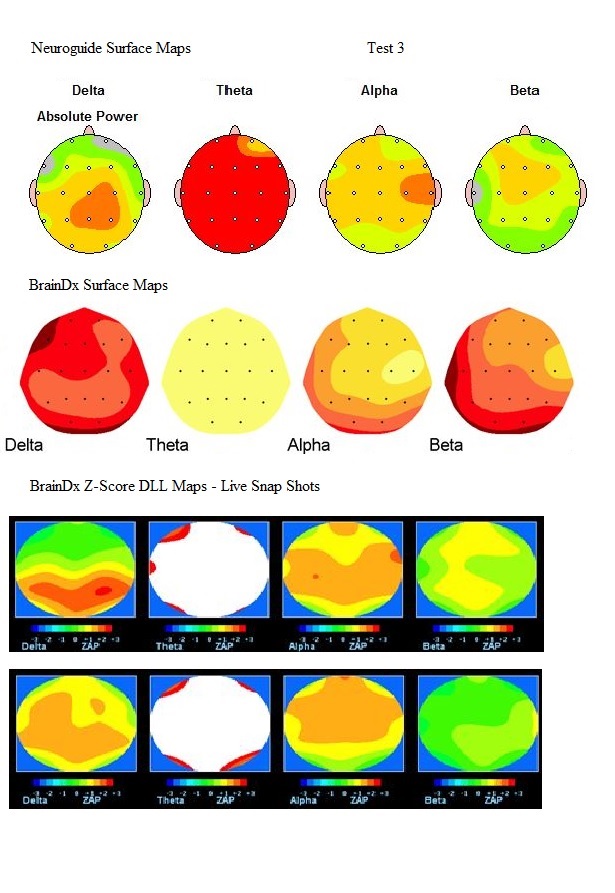
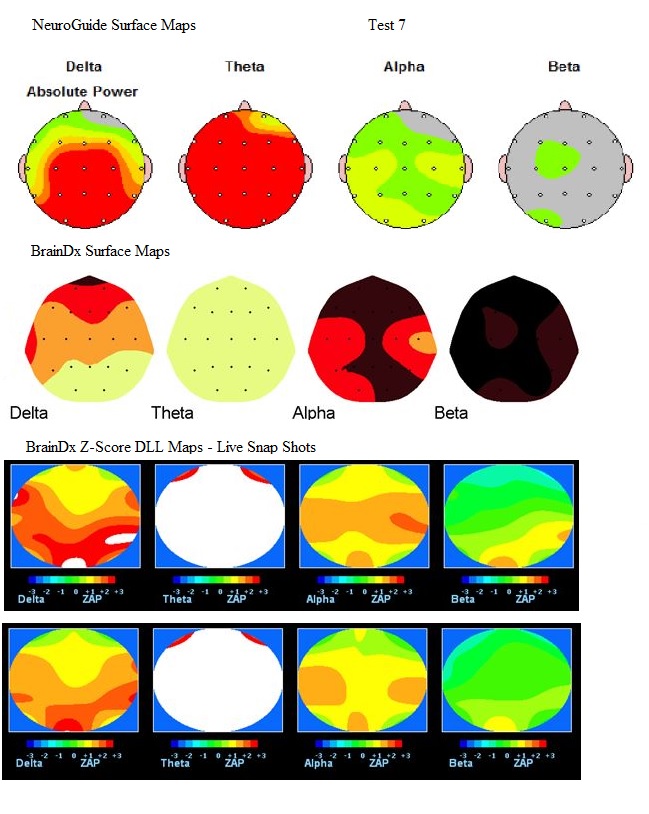
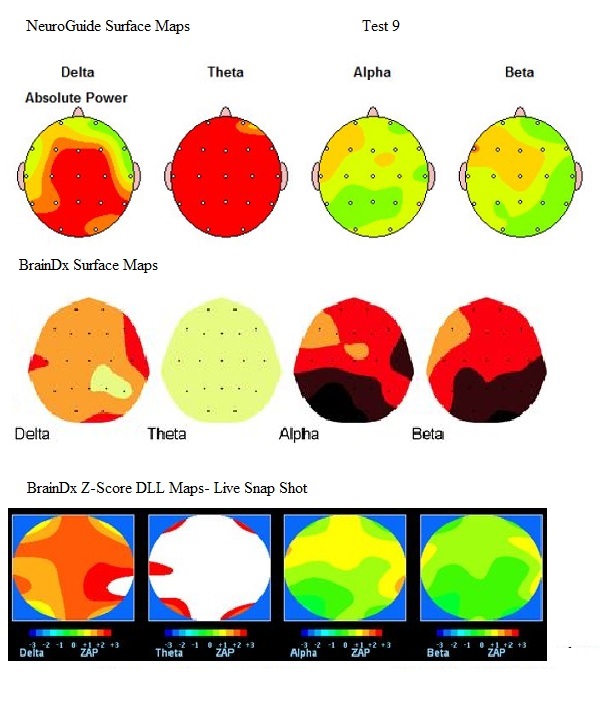
Example 3 shows a significant delta excess central posteriorly, highly significant diffuse theta excess, moderate diffuse alpha excess that is significant posteriorly, and significant beta excess, both anterior central, and posteriorly
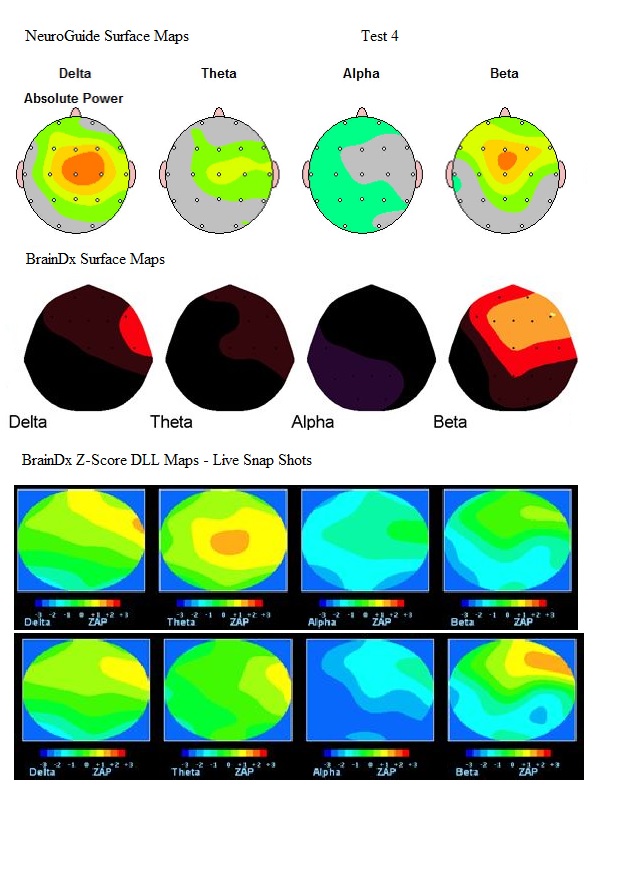
Example 4:
Example 5:
Example 6
Example 7
Example 8
Example 9
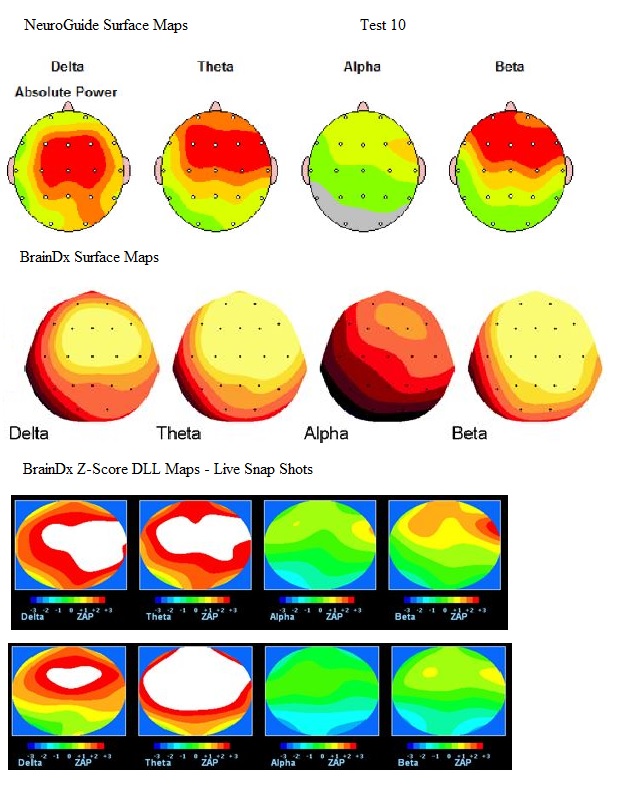
Example 10