Welcome to BrainMaster Technologies’ hub for educational tools! Here you will find various educational tools designed to give you a deeper look into the complex mechanisms of the brain.
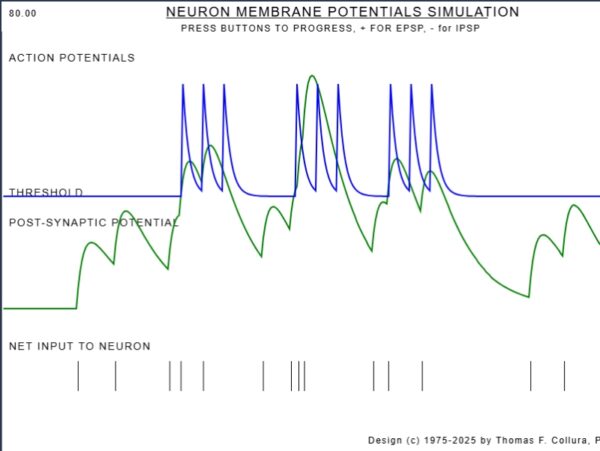
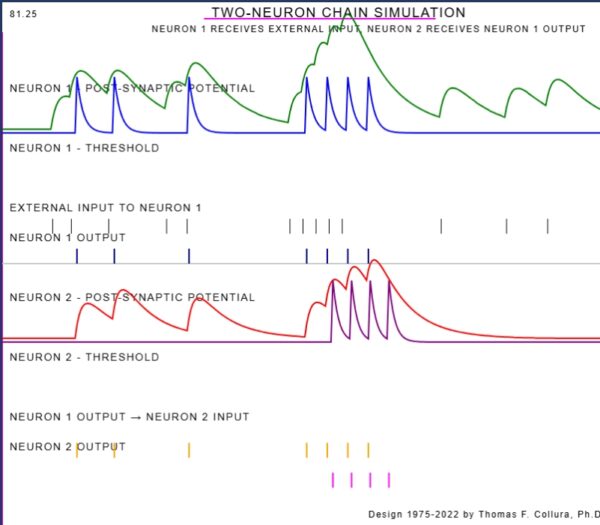
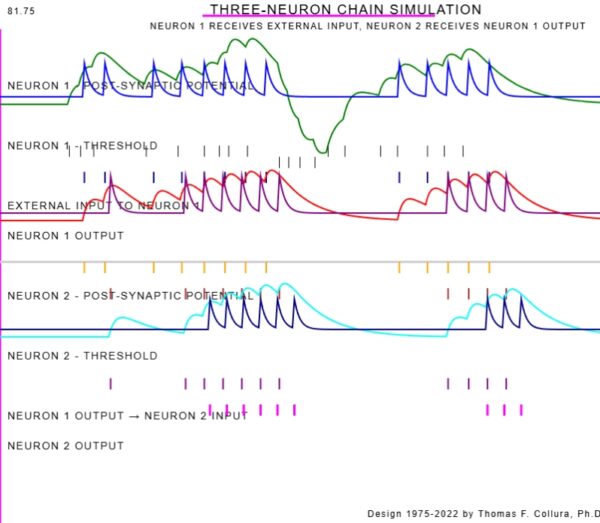
Investigate how neurons function at the lowest level. These simulations represent between 1 and 3 synapses in a chain. Each neuron has tens of thousands of synapses so using this simulation, we can see what each small piece of the neuron puzzle looks like! There are 3 standard simulations and 1 simulation that allows you to create a C Major chord when all neurons fire at simultaneously.
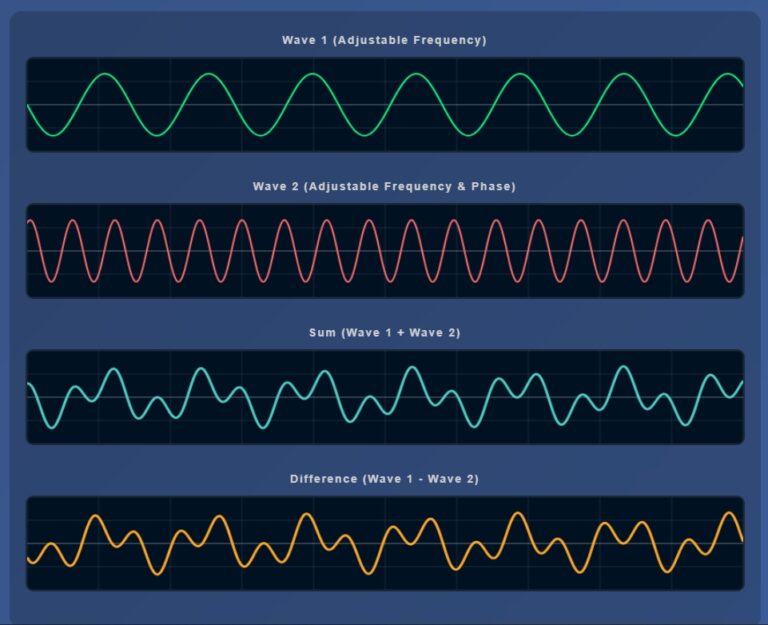
The Interactive Sine Wave Visualizer is an educational tool designed to help users explore the behavior of sine waves through real-time visualizations of frequency, phase, and wave interactions. It enables learners to adjust two individual waves and observe their sum and difference, revealing phenomena such as beats, constructive/destructive interference, and harmonic relationships. This simulation was created to support the teaching of physics, acoustics, signal processing, and mathematics by making abstract wave concepts visually intuitive and interactive.
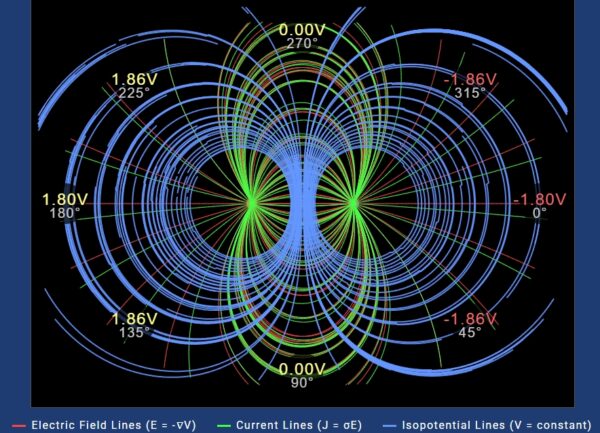
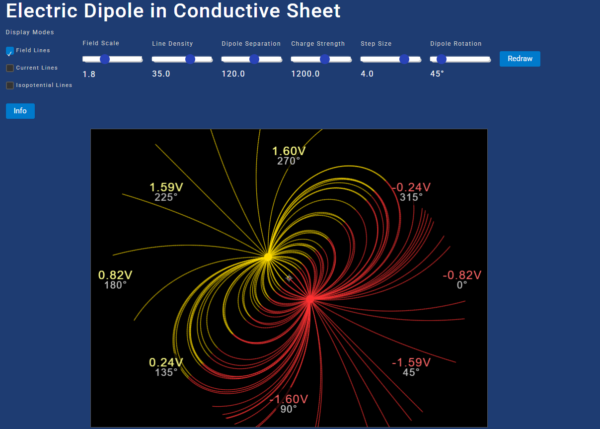
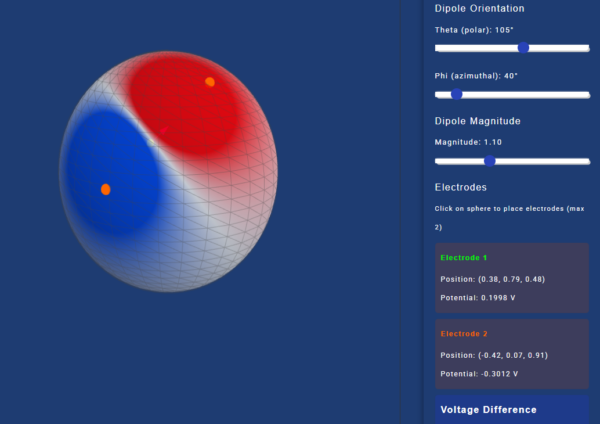
This interactive simulation tool accurately shows the electrical fields and currents in a sheet that simulates a slice of the brain in a living system. By adjusting the properties of the dipole, and seeing the changes in real time, you can learn how neurons produce electrical fields, currents, and voltages, and how volume conduction produces the potentials we can measure at the surface
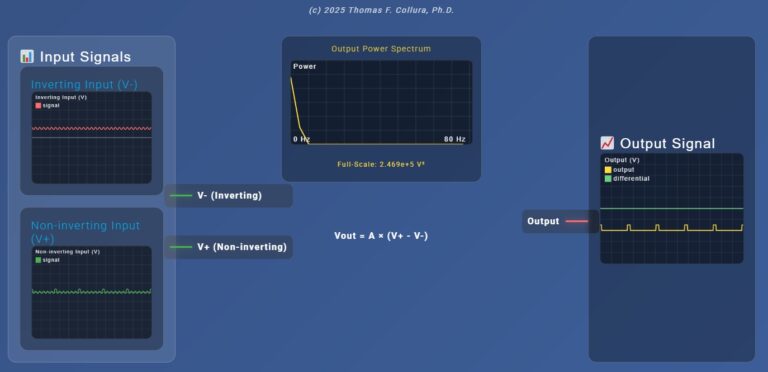
This interactive simulation allows you to design your own differential amplifier, and feed it with signals that you design, to see how it works in real time.
The simulation accurately shows the effects of gain, common-mode rejection ratio, noise interference, and other important factors in amplifier design and use.
Understand first hand what it means for an amplifier to be a precision EEG type amplifier, how the specifications matter, and how signals are affected when put through the amplifier.
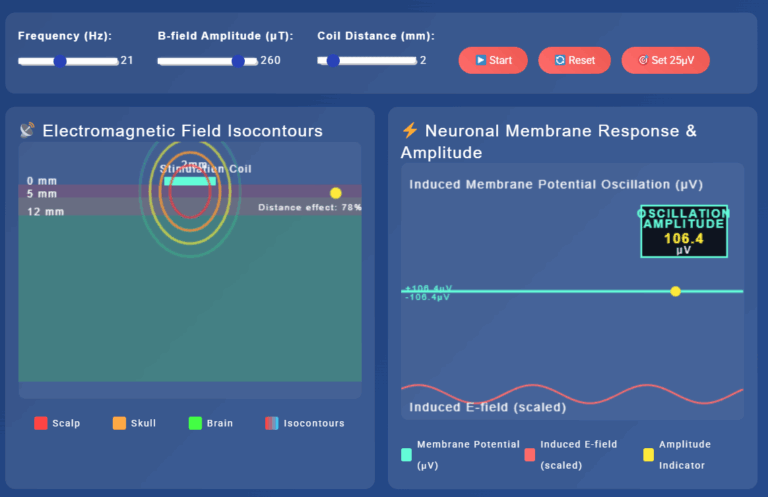
This provides an accurate, scientific simulation of a neurostimulator as applied to the brain, as is found in pEMF (pulsed Electromagnetic Field) therapy.
The simulation can adjust the key parameters of the stimulation and the coil location, and shows the changes in neuronal membrane potential produced by the coil stimulation.
Understand how pEMF affects the brain, in accurate detail.
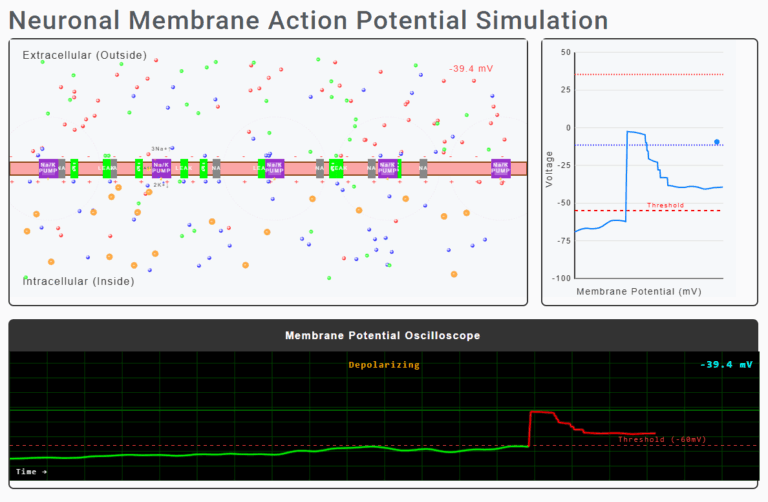
This provides an accurate, real-time illustration of the ion activity surrounding a neuronal membrane, including the membrane voltage potential, and changes in the voltage as the membrane properties and environment change.
Understand the role of sodium, potassium, chloride, and other ions in the activity of a cell membrane, including sodium pumps and ATP conversion.
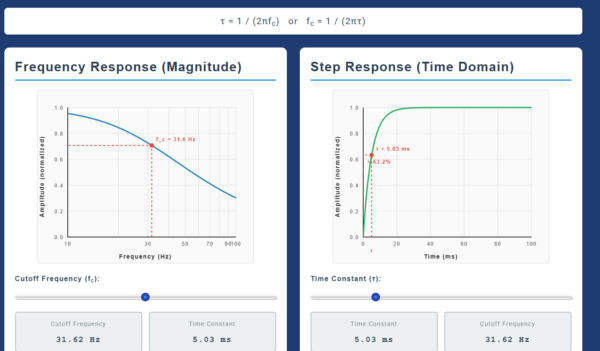
Low-Cut filter Interactive tool. Interested in ISF, ILF, and other low-frequency brain rhythms? This interactive tool shows the exact relationship between filter cutoff frequency, and response time constant.
Understand how using a very low frequency cutoff can provide accurately set time-constants for low-frequency EEG and related work.
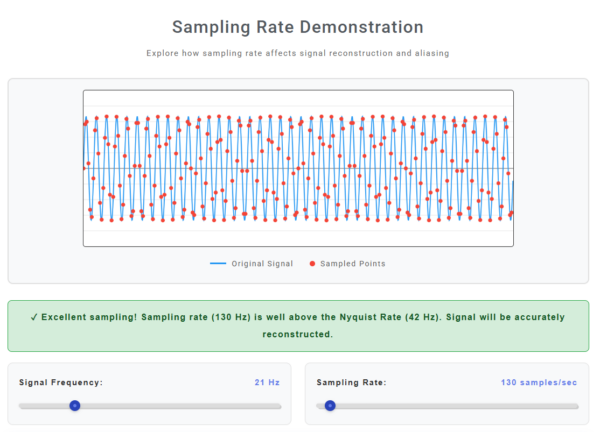
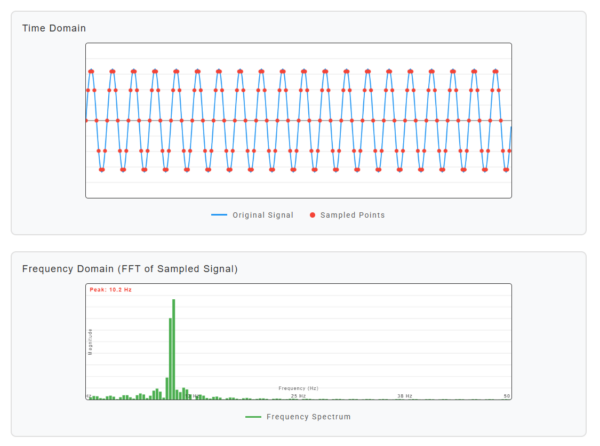
The Interactive Sampling Rate Visualizer allows the user to see the effects of digital sampling on a simple signal, which is essential to understanding how digital signals are used in computing. By adjusting the frequency of the signal, as well as the sampling rate, the effects of sampling are visible, including adequate and inadequate sampling, aliasing, and how a properly sampled signal appears in the form of computer data. With a frequency range of 1 to 100 Hz, and a sampling rate of 100 to 1000 samples/second, this simulation provides realistic results with the type of data found in EEG and biosignals analysis.
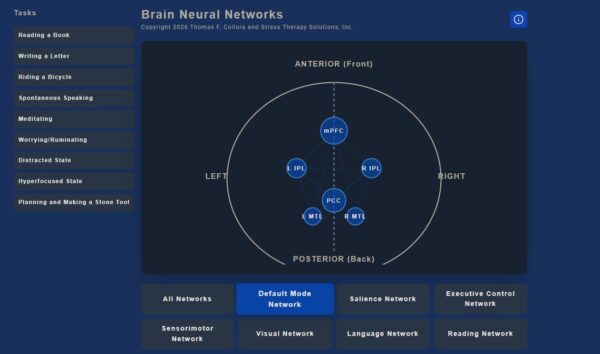
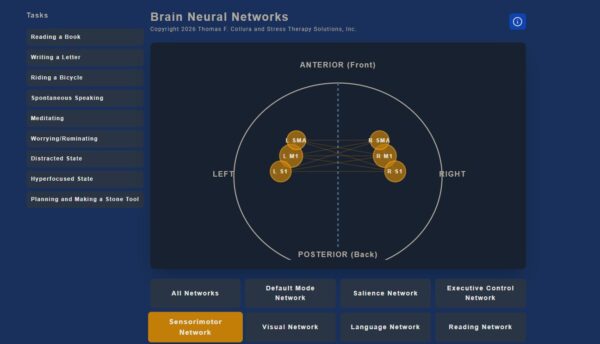
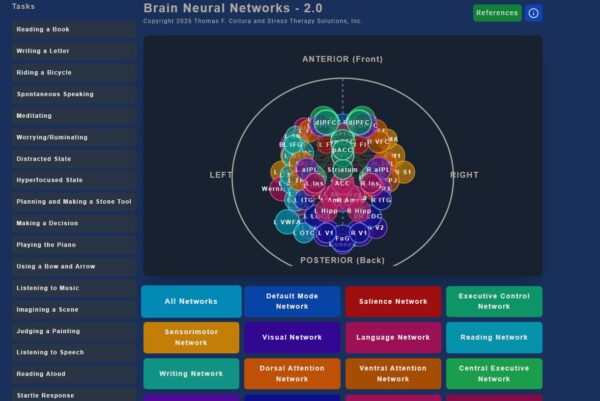
Brain networks are interconnected groups of brain regions that work together to perform specific functions. These networks communicate through synchronized neural activity.
This interactive diagram displays different brain networks as well as how various tasks utilize multiple brain networks.
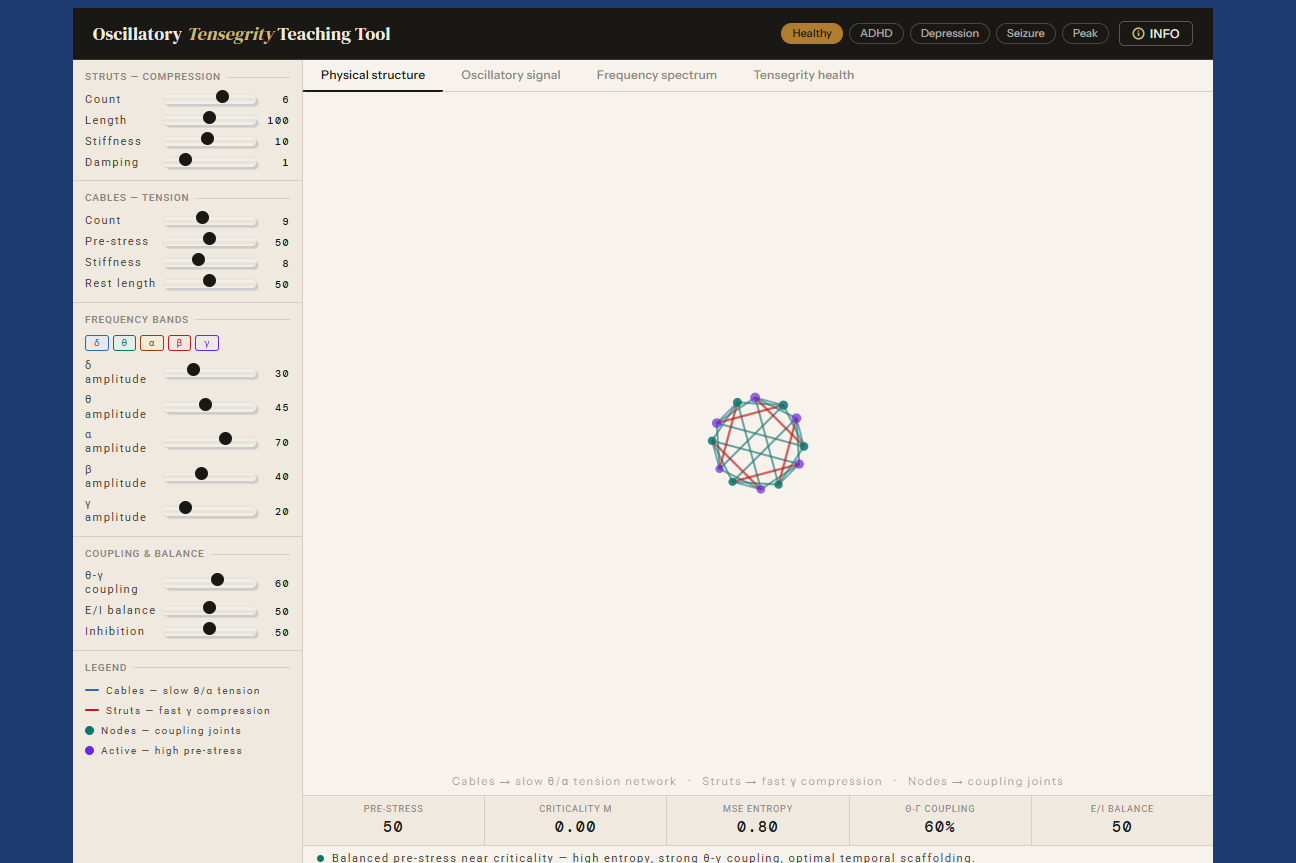
Brain oscillatory tensegrity is a framework that describes how the brain maintains dynamic stability through a temporal architecture analogous to Buckminster Fuller’s tensegrity structures. Just as a tensegrity dome holds its shape through a pre-stressed interplay of isolated compression struts and a continuous tension cable network — with no direct strut-to-strut contact — the brain maintains coherent cognition through a hierarchy of oscillatory rhythms held in distributed phase balance.
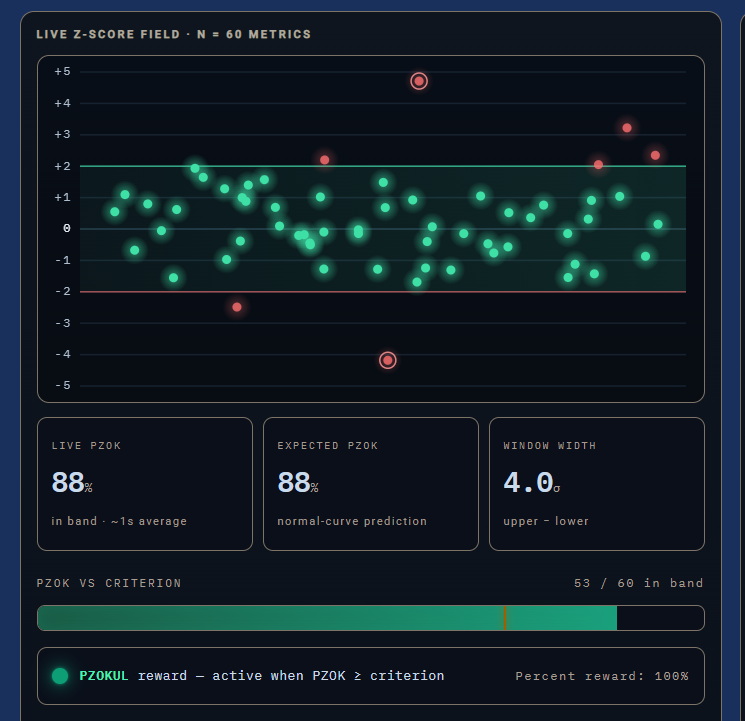
An interactive model of BrainMaster-style Percent Z-OK (PZOK) training. The two sliders set a target window, shown as a horizontal band. Each tracked z-score floats up and down as it moves in and out of the band. Watch the percent inside the band respond as you open and close the window. Reward fires (PZOKUL active) when PZOK rises above your criterion.
| Cookie | Duration | Description |
|---|---|---|
| ac_enable_tracking | 1 month | This cookie is set by Active Campaign to denote that traffic is enabled for the website. |
| _gat | 1 minute | Google Universal Analytics sets this cookie to restrain request rate and thus limit data collection on high-traffic sites. |
| Cookie | Duration | Description |
|---|---|---|
| CONSENT | 2 years | YouTube sets this cookie via embedded YouTube videos and registers anonymous statistical data. |
| _ga | 1 year 1 month 4 days | Google Analytics sets this cookie to calculate visitor, session and campaign data and track site usage for the site's analytics report. The cookie stores information anonymously and assigns a randomly generated number to recognise unique visitors. |
| _gat_gtag_UA_* | 1 minute | Google Analytics sets this cookie to store a unique user ID. |
| _ga_* | 1 year 1 month 4 days | Google Analytics sets this cookie to store and count page views. |
| _gcl_au | 3 months | Google Tag Manager sets the cookie to experiment advertisement efficiency of websites using their services. |
| _gid | 1 day | Google Analytics sets this cookie to store information on how visitors use a website while also creating an analytics report of the website's performance. Some of the collected data includes the number of visitors, their source, and the pages they visit anonymously. |
| Cookie | Duration | Description |
|---|---|---|
| test_cookie | 15 minutes | doubleclick.net sets this cookie to determine if the user's browser supports cookies. |
| VISITOR_INFO1_LIVE | 5 months 27 days | YouTube sets this cookie to measure bandwidth, determining whether the user gets the new or old player interface. |
| YSC | session | Youtube sets this cookie to track the views of embedded videos on Youtube pages. |
| yt-remote-connected-devices | never | YouTube sets this cookie to store the user's video preferences using embedded YouTube videos. |
| yt-remote-device-id | never | YouTube sets this cookie to store the user's video preferences using embedded YouTube videos. |
| yt.innertube::nextId | never | YouTube sets this cookie to register a unique ID to store data on what videos from YouTube the user has seen. |
| yt.innertube::requests | never | YouTube sets this cookie to register a unique ID to store data on what videos from YouTube the user has seen. |
| Cookie | Duration | Description |
|---|---|---|
| docs_visited_10761 | 5 months 27 days | Description is currently not available. |
| docs_visited_10764 | 5 months 27 days | Description is currently not available. |
| docs_visited_10767 | 5 months 27 days | Description is currently not available. |
| docs_visited_10770 | 5 months 27 days | Description is currently not available. |
| docs_visited_11013 | 5 months 27 days | Description is currently not available. |
| docs_visited_11016 | 5 months 27 days | Description is currently not available. |
| docs_visited_11020 | 5 months 27 days | Description is currently not available. |
| docs_visited_11265 | 5 months 27 days | Description is currently not available. |
| docs_visited_11269 | 5 months 27 days | Description is currently not available. |
| docs_visited_11275 | 5 months 27 days | Description is currently not available. |
| docs_visited_11278 | 5 months 27 days | Description is currently not available. |
| docs_visited_11281 | 5 months 27 days | Description is currently not available. |
| docs_visited_11525 | 5 months 27 days | Description is currently not available. |
| docs_visited_11528 | 5 months 27 days | Description is currently not available. |
| docs_visited_11532 | 5 months 27 days | Description is currently not available. |
| docs_visited_11536 | 5 months 27 days | Description is currently not available. |
| docs_visited_11778 | 5 months 27 days | Description is currently not available. |
| docs_visited_11791 | 5 months 27 days | Description is currently not available. |
| docs_visited_12033 | 5 months 27 days | Description is currently not available. |
| docs_visited_12037 | 5 months 27 days | Description is currently not available. |
| docs_visited_12042 | 5 months 27 days | Description is currently not available. |
| docs_visited_12048 | 5 months 27 days | Description is currently not available. |
| docs_visited_8962 | 5 months 27 days | Description is currently not available. |
| docs_visited_8966 | 5 months 27 days | Description is currently not available. |
| docs_visited_8970 | 5 months 27 days | Description is currently not available. |
| docs_visited_8975 | 5 months 27 days | Description is currently not available. |
| docs_visited_8979 | 5 months 27 days | Description is currently not available. |
| docs_visited_9219 | 5 months 27 days | Description is currently not available. |
| docs_visited_9223 | 5 months 27 days | Description is currently not available. |
| docs_visited_9227 | 5 months 27 days | Description is currently not available. |
| docs_visited_9231 | 5 months 27 days | Description is currently not available. |
| docs_visited_9235 | 5 months 27 days | Description is currently not available. |
| docs_visited_9474 | 5 months 27 days | Description is currently not available. |
| docs_visited_9478 | 5 months 27 days | Description is currently not available. |
| docs_visited_9486 | 5 months 27 days | Description is currently not available. |
| docs_visited_9490 | 5 months 27 days | Description is currently not available. |
| docs_visited_9732 | 5 months 27 days | Description is currently not available. |
| docs_visited_9736 | 5 months 27 days | Description is currently not available. |
| docs_visited_9740 | 5 months 27 days | Description is currently not available. |
| docs_visited_9744 | 5 months 27 days | Description is currently not available. |
| prism_649921125 | 1 month | Description is currently not available. |
| viewer_id | 1 year | No description available. |
| __mmapiwsid | never | No description available. |