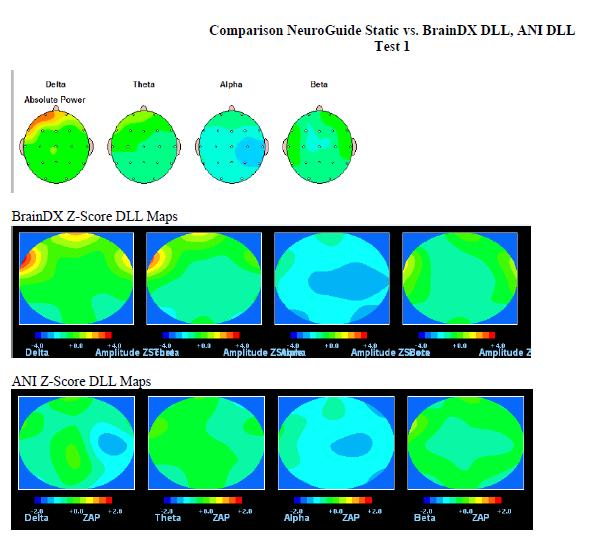
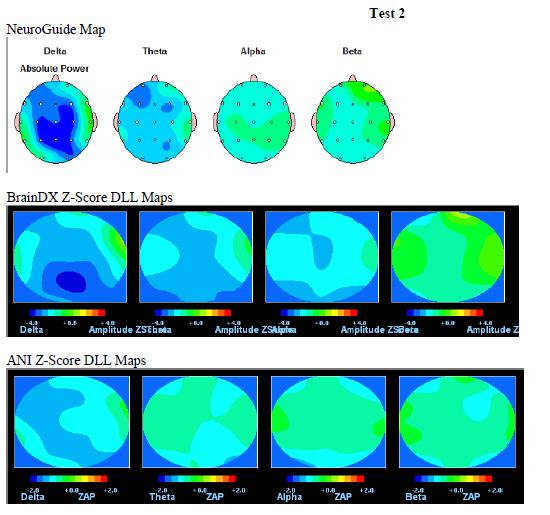
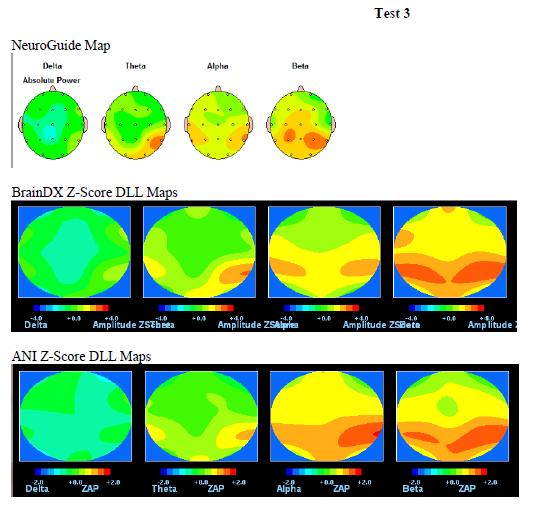
In order to confirm the expected match between surface maps made using the Applied Neuroscience software (NeuroGuide or the ANI Z DLL) and BrainDX, we produced the following test maps. They show the essentially identical match between ANI and BrainDX in three illustrative samples. These findings are relevant to live z-score training, in that they show that the central target values are the same whether an FFT or a JTFA method is used, once one accounts for the effect of the tapering window used in the FFT. Quite simply, if a 10 microvolt alpha wave appears in a record, the result of either an FFT or a JTFA analysis should produce a result of “10 microvolts” once proper corrections are used.
Recent attempts to disprove this have confounded the issue by using the FFT result of power, which is first of all expressed in “microvolts squared,” and which also includes the uncompensated effect of the tapering window. Therefore, while a JTFA using this comparison would show 10 microvolts, the FFT would show a result near 70 “microvolts squared.” This is simply a case of deliberately comparing different units of expression, and obscures the essential equivalence of the methods.
In our years of work using both live and static z-scores and maps, one finding is consistent. The maps look the same generally, in that positive deviations from normal appear in both, and negative deviations from normal appear in both. The mean targets are the same, however, as evidenced by the fact that a normal EEG that produces “green maps” in one method, invariably produces “green maps” by the other method. In addition, particular focal abnormalities always appear in the same location and direction using both methods, except that the dynamic maps typically show a smaller deviation in z-scores. This has led to the historic need to adjust by “adding 1.0 to 1.5 standard deviations” to the dynamic numbers. When dynamic z-scores were introduced years ago, this was a source of confusion, and clients asked, why it had to be there. The answer is that it does not “have” to be there, but it is introduced by using the dynamic norms for comparison. If, however, static norms are used for comparison, the only difference is that the z-scores now become larger, in concert with the static maps, which is what users expected all along, but were unable to achieve. Now, by using the static norms in the real-time implementation, it is possible to do live z-score training while seeing z-scores that agree with the static maps, and to see the maps converge to the same maps one would see if one did a static analysis of the session data.
A publication is in preparation that shows that (1) the mean (target) values for EEG parameters are necessarily identical for either static or dynamic analysis, as long as the analyses are set up to produce equivalent output (e.g. “microvolts”), and that (2) the normalization using logarithms that is used for both static and for dynamic z-scores produces gaussian distributions for either. In other words, the correction for Gaussian distribution is simply a logarithmic transform, and the choice of the transform is the same whether dynamic or static data are used.
To further elaborate on this, attached is a Comparison of NeuroGuide Static vs. BrainDX DLL vs. ANI DLL. How this was done: