The attached poster was presented at the 2014 meeting of the Society for Applied Neuroscience in Utrecht, the Netherlands
Disclaimer: The content below was generated with the assistance of AI and then reviewed and edited by BrainMaster Technologies, Inc. It is provided for educational and informational purposes only and does not constitute medical advice.
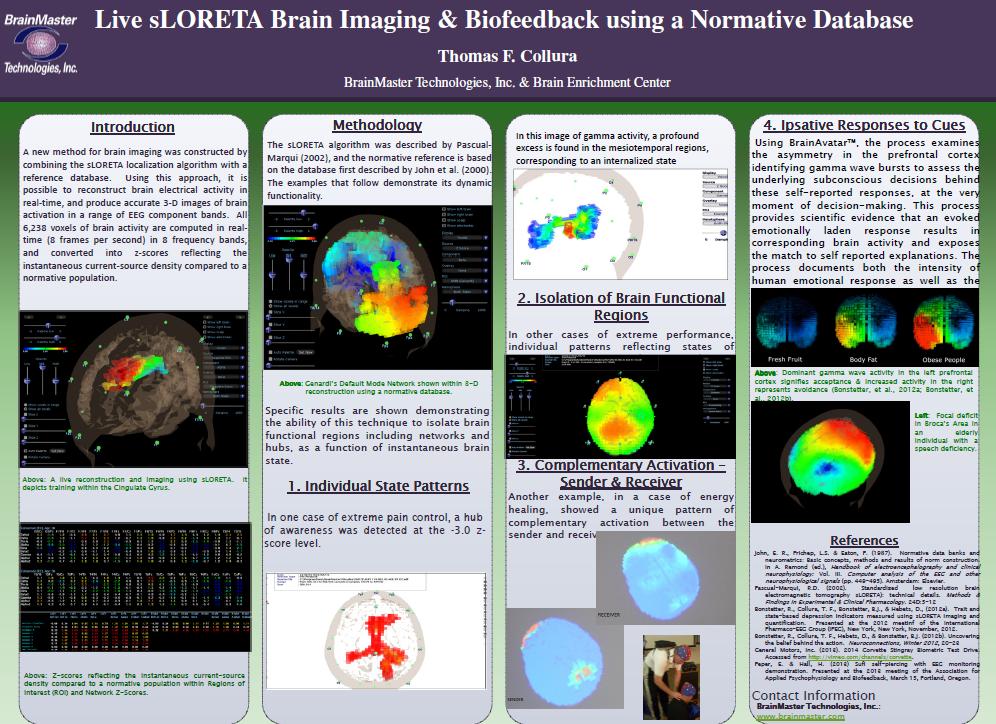
Live sLORETA Brain Imaging & Biofeedback Using a Normative Database – Summary #
Overview #
This poster presents a method for real-time sLORETA brain imaging and neurofeedback that incorporates a normative EEG database to support interpretation, training, and assessment. The approach enables practitioners to visualize and train brain activity patterns linked to functional regions, emotional responses, and cognitive networks.
Introduction #
A novel system was developed to provide instantaneous 3D cortical activity mapping from scalp EEG, displayed in real time. The integration of a normative reference allows deviation-from-norm metrics, offering additional context for interpreting client brain states. The method is designed for clinical decision support, research applications, and neurofeedback training workflows.
Methodology #
The system uses:
-
sLORETA inverse solutions to localize brain activity in 3D
-
Frequency-based EEG decomposition mapped to cortical regions
-
Normative comparisons to highlight statistically elevated or reduced activity
-
Live feedback loops for session-based training
Visuals on the poster (page 1) include color-mapped cortical activation models and interface screenshots showing real-time parameter adjustments.
Key Functional Capabilities #
1. Individual Brain State Patterns #
The system highlights moment-to-moment EEG activity, emphasizing specific functional hubs (e.g., alpha, theta, beta distributions). The poster includes examples demonstrating how individuals’ instantaneous brain states differ from normative patterns.
2. Isolation of Functional Regions #
sLORETA activity is mapped to distinct brain regions, supporting analysis of performance-related or cognitively meaningful patterns. This helps identify regions that may benefit from targeted neurofeedback protocols (non-therapeutic).
3. Connectivity & Co-Activation #
The poster shows “Sender–Receiver” maps that illustrate directional activation flows between cortical areas. These visualizations help contextualize how regions interact during mental tasks or resting-state dynamics.
4. Affective / Cue-Response Patterns #
One section displays how brain activity changes in response to emotional or sensory cues. The color maps reveal activation differences between neutral and stimulus conditions, demonstrating the system’s ability to track state-dependent brain changes.


