

Why Average is Good – Foundations of Optimal Functioning and Z-Score Neurofeedback
BrainMaster Technologies · Thomas Collura Blog
“Average Is Good, Extremes Are Bad”
Northoff’s Inverted U and the Case for Live Z-Score Training
“The constancy of the internal environment is the condition for a free life.”Claude Bernard, Leçons sur les phénomènes de la vie, 1878
Thomas F. Collura, Ph.D.BrainMaster Technologies, Inc.August 2026
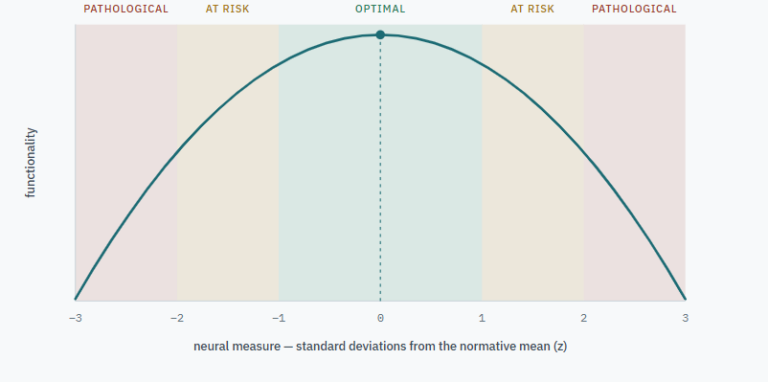
A 2019 review by Georg Northoff and Shankar Tumati in Neuroscience and Biobehavioral Reviews makes an argument that ought to be read carefully by everyone who does neurofeedback[1]. Their thesis is stated in the title, and it is deliberately blunt: average is good, extremes are bad. Across four independent lines of neuroimaging evidence, they show that the relationship between a neural measure and the mental function it supports is not linear. It is an inverted U. Mid-range expression of the mechanism yields optimal function. Departure toward either extreme — too much or too little — yields sub-optimal function, then risk, then pathology.
Note on constructionThis commentary was constructed by Tom Collura using Anthropic’s Claude, working from the Northoff & Tumati (2019) review supplied directly to the agent, together with previously published BrainMaster material on live z-score training. No other sources were used.
Readers who intend to quote the secondary citations should verify them against the primary literature first. References [7], [8] and [11] are carried forward from earlier BrainMaster commentary and are given here without complete bibliographic detail. The argument connecting the inverted-U model to z-score training is theoretical, and is offered as such.
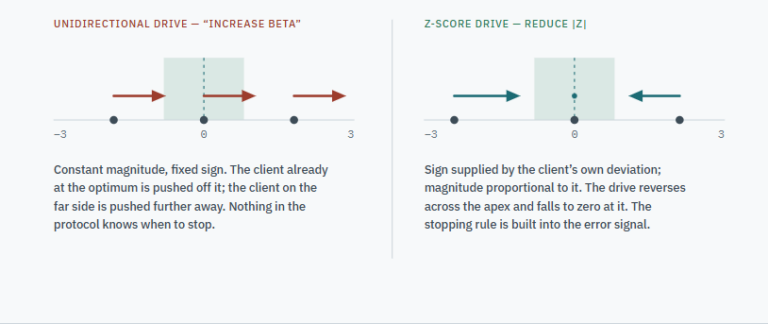
I want to make a case here that live z-score training (LZT) is, in its mathematics, the neurofeedback method that already encodes this model. Not by accident, and not as a retrofit. A z-score is a signed distance from the middle of a distribution. Training toward z = 0 is, quite literally, training toward the apex of Northoff’s curve — and doing so bidirectionally, from whichever side the client happens to be sitting on. Conventional band-power training, whatever its clinical merits, cannot express that idea. It encodes a direction, not a target.
The linear assumption and what it costs us
Northoff and Tumati begin with a methodological complaint that will be familiar to anyone who has read the neurofeedback literature with a critical eye. The standard study design compares a patient group to a control group on some neural measure, finds a mean difference, and stops. Statistically this rests on detecting non-overlapping regions of two Gaussians. Conceptually it commits us to two assumptions we rarely notice we are making: that the two populations are categorically distinct, and that the relationship between the measure and the function is monotone.
The authors illustrate the trap with the amygdala. Hypoactivation to emotional faces is observed in schizophrenia; the healthy group shows more activation. A linear reading of that finding predicts that still more amygdala activation should mean still better emotional function. It does not. Higher-than-healthy amygdala response is what you find in PTSD. The linear model has no vocabulary for this. In their Figure 1B the region above the healthy group’s mean is simply marked with a question mark, because the design never sampled it.
That question mark is the whole problem. And it is not confined to fMRI. It is the same question mark that sits above every “increase beta, decrease theta” protocol ever run.
The non-linear alternative has good precedent in biology. Glucose and insulin are regulated into a narrow band because the biological purpose is adequate metabolic energy, not maximal glucose. Deviate in either direction far enough and consciousness itself clouds. Northoff and Tumati make this distinction explicit and call it function versus functionality: the question is not how large a measure is, but whether it is serving its purpose. Local field potentials do not simply rise with stimulation — they rise to the extent needed to execute the response, and when they rise further you are looking at a seizure.
Inverted-U relationships are by now well established at the molecular and cellular scale. Dopamine and working memory follow one[3]. Locus coeruleus–norepinephrine gain and task performance follow one[4]. He and Zempel titled their 2013 paper on trial-to-trial LFP variability and behavior “Average is optimal,” and found exactly that[2]. What Northoff and Tumati add is the claim that the same geometry survives all the way up to mental features — perception, consciousness, selfhood, the felt speed of time.
Four windows on the same curve
Their four examples are worth summarizing, because each one lands somewhere a neurofeedback practitioner already works.
Excitation–inhibition balance and perceptual binding
Ferri and colleagues measured the temporal binding window — the span over which asynchronous multisensory events are still fused into one perceived event — alongside genetic and MRS-based indices of excitation–inhibition balance, and schizotypy scores, all in healthy subjects[5]. Both low and high E/I scores produced a prolonged binding window and elevated schizotypy. Only intermediate values gave a short, crisp binding window and low schizotypy. This is an inverted U found entirely within the normal range, in people no one would diagnose.
Long-range temporal correlations and the richness of consciousness
The power law exponent (PLE) — the slope of the spectrum, indexing the relative weight of slow versus fast frequencies — is low in psychedelic and sleep-deprived states, where the contents of consciousness are abnormally rich, and high in sedation, early sleep, and minimally conscious states, where contents are sparse. Both ends are dysfunctional. Waking, ordinary, competent consciousness sits in the middle. At the far extreme — coma, deep anesthesia — the scale-free structure collapses altogether.
Medial prefrontal activity and the sense of self
MPFC activity, at rest and task-evoked, runs high in depression, where self-focus is pathologically elevated and external focus collapses, and low in mania, where the opposite holds. Balanced internal/external focus corresponds to intermediate MPFC activity.
Network variability and the perception of time
This is the example I find most instructive. Neural variability (SD) in the sensorimotor and visual networks tracks the perception of inner and outer time speed. Depressed bipolar patients show low SMN variability with high VN variability — slow inner time, fast outer time. Manic patients show the reverse. And here is the detail that matters: symptoms correlated with the ratio of SD between the two networks, not with the SD of either network alone.
A z-score is a distance from the middle
Now the connection. A z-score does not report a magnitude. It reports how far a value sits from the center of a reference distribution, and in which direction, in units of that distribution’s own spread. Plot functionality against z and you get Northoff’s figure without any additional assumptions: an optimum at z ≈ 0, a suboptimal-but-still-functioning shoulder around |z| ≈ 1.5–2, and a pathological tail beyond |z| ≈ 2.5–3, symmetric on both sides.
That is not an analogy. That is the same curve.
Live z-score training rewards the client for reducing |z| — for moving toward the middle from wherever they currently stand. Three properties follow, and all three are exactly what the inverted-U model demands.
It is bidirectional. The clinician does not have to decide in advance whether to reward an increase or a decrease. The sign is supplied by the client’s own deviation, computed sample by sample. If frontal theta is high, the reward pulls it down; if it is low in the same client at a different site, the reward pulls it up. Conventional protocols must commit to a direction before the session starts, and that commitment is a linear-model commitment whether we mean it that way or not.
It is self-extinguishing. As |z| approaches zero the drive toward change goes to zero with it. There is no gradient left to push on. This is the property that distinguishes a regulator from an amplifier, and it is why the training does not, by construction, run a client through the optimum and out the other side. An open-ended “more beta” instruction has no such stopping rule. It is a goal-seeking process with no set point, and Wiener told us what those do: they oscillate, or they run away[10].
It defines a region, not a point. In BrainMaster’s implementation the reward condition is a percentage of selected z-scores falling inside a specified window — the percent-z-OK criterion[9][11]. The clinician sets the width of the green zone and how much of the trained set must be inside it. That is the operational form of “an optimal range,” which is precisely the object Northoff and Tumati say the field lacks a model for.
Balance, not magnitude
The fourth example — the SMN/VN variability ratio — is the one that argues hardest for the multivariate character of LZT specifically, as opposed to single-metric z-training.
Northoff and Tumati’s conclusion there is that the diagnostically meaningful quantity was a relationship between two networks, not a property of either one. Neither network’s variability, taken alone, correlated with symptoms. The ratio did. They close that section by suggesting the field should be looking at balances and ratios between networks rather than at single neural measures.
This is the design principle behind the whole-head normalization approach described in U.S. Patent 9,706,939[9]. LZT does not train a scalar. It trains power, asymmetry, coherence, and phase across sites simultaneously, all rendered into the same normalized units, all pulled toward their respective optima at once. Asymmetry and coherence are inter-site relationships — they are, in the EEG domain, exactly the class of quantity Northoff is pointing at. And because every metric is expressed in standard deviations, quantities that are otherwise incommensurable can be combined into a single reward decision without the clinician having to invent weightings.
Floating Z-Scores
An interactive model of BrainMaster-style Percent Z-OK (PZOK) training. The two sliders set a target window, shown as a horizontal band. Each tracked z-score floats up and down as it moves in and out of the band. Watch the percent inside the band respond as you open and close the window. Reward fires (PZOKUL active) when PZOK rises above your criterion.
Live z-score field · N = 60 metrics
Protocol mode
What this is — and what it is not
The relationship it shows is real. PZOK is the percent of monitored z-scores inside the target limits at a given moment; widening the band raises it, narrowing it lowers it, and PZOKUL is the reward event that turns on once PZOK clears a set threshold. Those mechanics match how %ZOK / Live Z-Score Training is configured.
The wide trend screen mirrors the real readout. Three lines track over time, as on the BrainMaster Z-Score Training tab: blue is PZOK (percent of z-scores OK / inside the window), green is the reward threshold, and red is Percent Reward — the share of recent time the threshold was met. When blue holds above green, red climbs.
Dynamic vs manual protocols. You always set the z-thresholds (the window) yourself. With Dynamic thresholding off, you also fix the reward criterion: narrow the window and watch PZOK fall below that flat criterion — Percent Reward collapses and the client stops being reinforced. Switch dynamic on and the criterion tracks the recent PZOK level (sitting at its 45th percentile), holding Percent Reward near ~55% and following the signal smoothly as it drifts — steady, with no lag or large catch-up gaps. That is the essence of a dynamic-threshold protocol. Either way the stuck and far-outlier metrics can't be captured, so PZOK never quite reaches 100%.
The motion is smoothed on purpose. Each score drifts slowly and the Live PZOK readout is a short (~1 second) rolling average, so the number is readable and the reward lamp does not strobe. Real systems likewise average the feedback signal and apply a sustained-reward criterion rather than reacting to every instantaneous sample. The reward tone, when enabled, is a simplified stand-in for the auditory reward contingency — a middle-C voice tracks the same in-band/out-of-band state as the lamp, and E and G are layered in purely as a graded illustration of PZOK rising further above criterion. It is not a calibrated BrainMaster feedback voice, point-scoring, or MIDI mapping, and the note thresholds are an arbitrary teaching choice, not a clinical parameter.
The distribution is fat-tailed, not tidy. Most metrics drift tightly around zero. A minority (~15%) range wider — the variable outliers — but they drift slowly rather than jumping, the way a deviant metric actually behaves. And a handful (~4%, shown ringed) are chronically stuck near ±4.5 with little variability — the persistently abnormal metrics that training works hardest to recover, which is closer to how a real brain looks than a cloud that bounces everywhere. "Expected PZOK" is computed from this same three-part mixture, so the readout tracks the cloud closely.
What is deliberately omitted. No EEG hardware, no NeuroGuide / Applied-Neuroscience normative database, no artifact rejection (in reality a blink throws z-scores wild and can falsely trip reward), and only 10–100 stand-in metrics (your slider) versus the ~248 a 4-channel montage trains across power, asymmetry, coherence, and phase. Use it for intuition about the window↔reward tradeoff, not for clinical decisions.
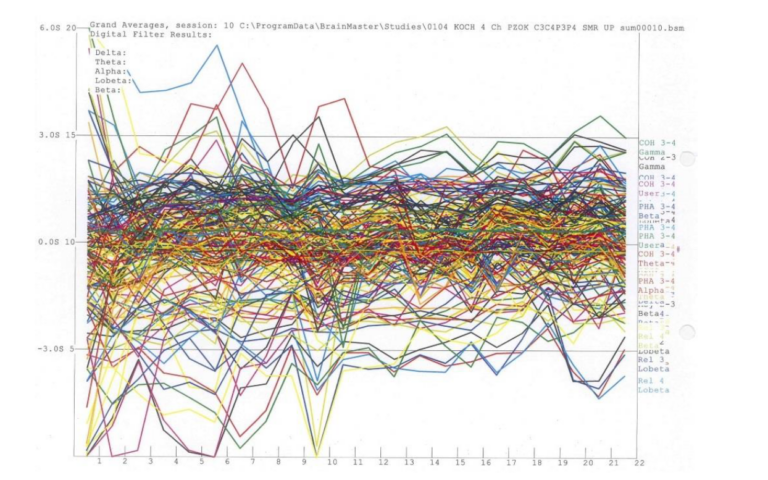
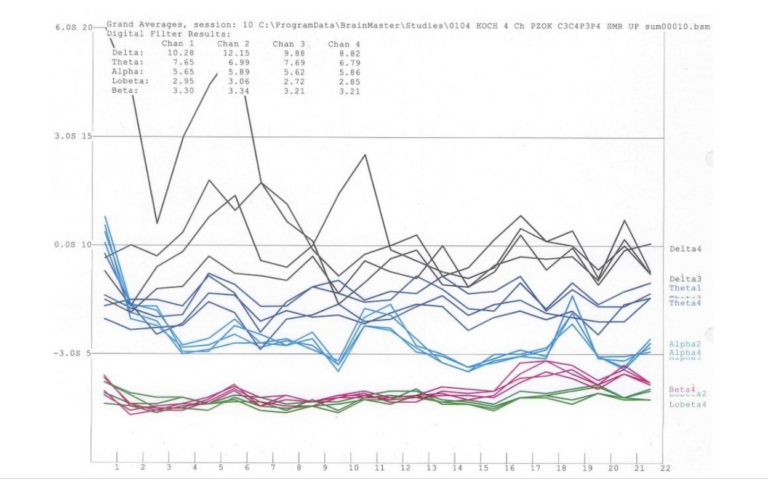
There is a further consequence that deserves stating plainly. When you train one band at one site and ignore everything else, you have no way to detect that your intervention has pushed some other metric off its own optimum. Multivariate normalization makes compensatory dysregulation visible and, more to the point, penalizes it in the reward signal. Enriquez-Geppert and colleagues have argued that theta/beta-ratio training failed in the ICAN trial partly because a network-level approach was called for[7]; Pérez-Elvira and colleagues found that live z-score training produced better change in the theta/beta ratio than conventional theta/beta training did[8]. That result is counterintuitive under a linear model and unsurprising under an inverted-U one. If the target is a balance, the method that trains balances will hit it more reliably than the method that pushes one term of the ratio in one direction.
The yellow zone, and why dimensional beats categorical
Northoff and Tumati devote their discussion to the implications for psychiatric classification. DSM-5 and ICD-10 are categorical: a condition is present or absent. RDoC[6], cognitive ontology, and HiTOP all propose dimensional alternatives, but as the authors note, none of them supplies a neuro-mental model that actually explains why the transition from normal to pathological should be smooth. The inverted U supplies one. The yellow shoulder of the curve is a real place — biologically abnormal, functionally still adequate, and at elevated risk.
Z-scores are dimensional by construction. They have never asked whether a client meets criteria. They ask where on a continuum a measure lies, and they answer in the same units for a client at |z| = 1.2 and a client at |z| = 3.5. This is why LZT has always sat comfortably in two places the categorical framework handles badly: sub-threshold presentations, and optimal-performance work with clients who have no diagnosis at all. Ferri’s finding — that extreme values within the healthy range already separate optimal from sub-optimal functioning — is the empirical warrant for that second use case, and I do not think our field has fully absorbed it.
What this predicts, and how it could be wrong
I would rather state a position that can be tested than one that cannot, so let me be specific about the claims and their exposure.
The model predicts that outcome should track reduction in absolute deviation, not change in any signed direction. It predicts that a client who begins with z below the mean and one who begins above it should both improve, and that a protocol which cannot reverse its own polarity will help one and harm the other. It predicts that clients starting nearer z = 0 have less to gain, which is a real limit on the method and should show up as a smaller effect in unselected samples. And it predicts — this one is directly testable with data most of us already have — that successful LZT should move the spectral slope toward the normative range from either side, since the PLE is nothing more than a summary of the slow/fast power balance that whole-head z-score training is already normalizing band by band. To my knowledge nobody has run that analysis. It would be a good study.
The honest caveats are these. Northoff and Tumati’s four examples are drawn from fMRI, MRS, and genetics, not from EEG z-score training; the bridge I am building here is theoretical, and it needs empirical planks. More seriously, Holmes and Patrick have argued directly against the assumption that the population mean is the individual optimum[12], and Northoff and Tumati cite them. The apex of the curve may be displaced for a given person by age, by handedness, by medication, by a life spent doing something unusual with their brain. This is not a fatal objection to z-score training, but it is a real constraint on naive z-score training — and it is the reason individualized reference databases matter, and the reason a clinician should be willing to set a target other than zero when the clinical picture calls for it. The method supplies the geometry. It does not relieve anyone of the obligation to know where the apex is for this client.
Conclusion
The dominant assumption in our field, mostly unexamined, has been that neural measures relate to mental function monotonically: more of the good frequency, less of the bad one. Northoff and Tumati have assembled four independent bodies of evidence saying that assumption is wrong, and wrong in a specific and correctable way. The relationship is an inverted U. Optimal function lives in the middle. Both tails are pathological, and the transition between them is continuous rather than categorical.
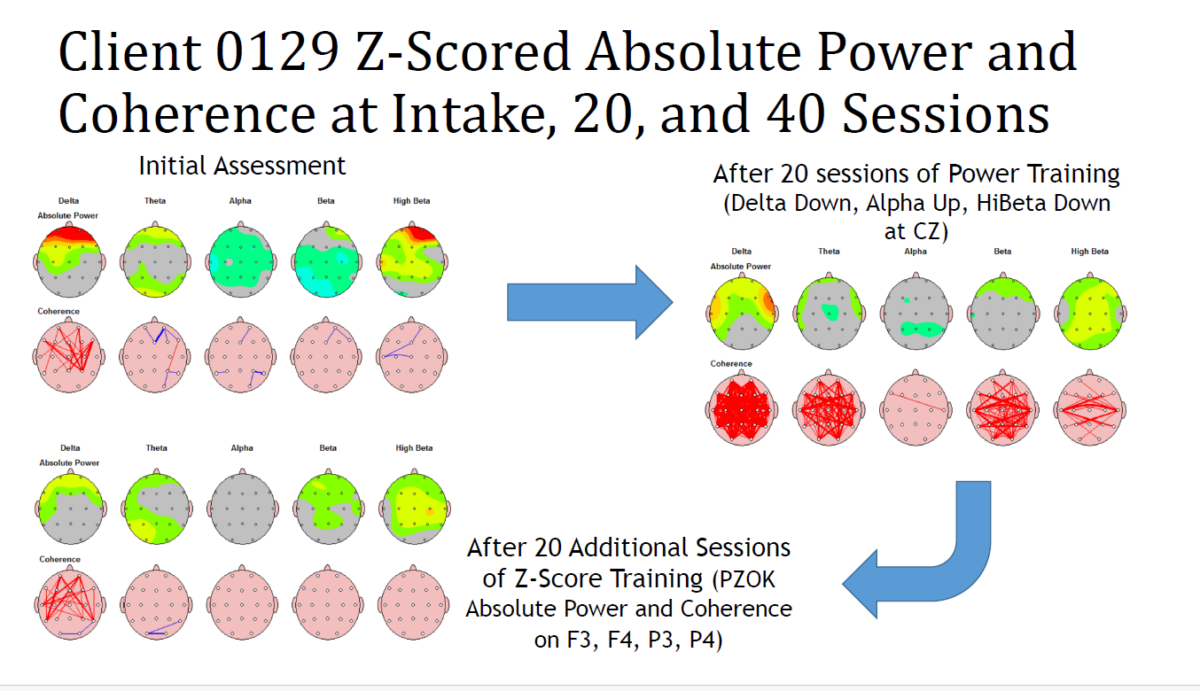
Live z-score training was designed around a homeostatic, error-driven, multivariate control loop rather than a unidirectional drive signal. It rewards proximity to the center rather than magnitude in a direction; it reverses its own sign as the client’s deviation reverses; it stops pushing when the deviation is gone; it operates on relationships between sites rather than on isolated scalars; and it speaks in the dimensional units that the whole enterprise of precision psychiatry is trying to move toward.
Training toward the average is not training toward mediocrity. It is training toward regulation. Bernard understood that about the internal milieu a century and a half ago, and Wiener understood it about goal-seeking systems seventy-five years ago. What Northoff and Tumati have done is show us the curve, in four different mental domains, with the data attached. We already have the instrument that fits it.
References
- Northoff, G., Tumati, S. (2019). “Average is good, extremes are bad” — Non-linear inverted U-shaped relationship between neural mechanisms and functionality of mental features.Neuroscience and Biobehavioral Reviews, 104, 11–25.
- He, B.J., Zempel, J.M. (2013). Average is optimal: an inverted-U relationship between trial-to-trial brain activity and behavioral performance.PLoS Computational Biology, 9, e1003348.
- Cools, R., D’Esposito, M. (2011). Inverted-U-shaped dopamine actions on human working memory and cognitive control.Biological Psychiatry, 69, e113–e125.
- Aston-Jones, G., Cohen, J.D. (2005). An integrative theory of locus coeruleus-norepinephrine function: adaptive gain and optimal performance.Annual Review of Neuroscience, 28, 403–450.
- Ferri, F., et al. (2017). A neural “tuning curve” for multisensory experience and cognitive-perceptual schizotypy.Schizophrenia Bulletin, 43, 801–813.
- Insel, T., et al. (2010). Research domain criteria (RDoC): toward a new classification framework for research on mental disorders.American Journal of Psychiatry, 167, 748–751.
- Enriquez-Geppert, S., Krc, J., van Dijk, H., deBeus, R.J., Arnold, L.E., Arns, M. (2025). Theta/beta ratio neurofeedback effects on resting and task-related theta activity in children with ADHD. Applied Psychophysiology and Biofeedback, 50(4), 667–685. doi:10.1007/s10484-024-09675-w — online Dec 2024
- Pérez-Elvira, R., Oltra-Cucarella, J., Carrobles, J.A. (2020). Comparing live Z-score training and theta/beta protocol to reduce theta-to-beta ratio: a pilot study. NeuroRegulation, 7(2), 58–63. doi:10.15540/nr.7.2.58
- Collura, T.F., Mrklas, K.J., Collura, T.J. Multi-channel, multi-variate whole-head normalization and optimization system using live Z-scores. U.S. Patent 9,706,939, issued July 18, 2017.
- Wiener, N. (1988).The Human Use of Human Beings: Cybernetics and Society. Da Capo Press.
- Collura, T.F., Guan, J., Tarrant, J., Bailey, J., Starr, F. (2010). EEG biofeedback case studies using live Z-score training and a normative database. Journal of Neurotherapy, 14, 22–46. doi:10.1080/10874200903543963
- Holmes, A.J., Patrick, L.M. (2018). The myth of optimality in clinical neuroscience.Trends in Cognitive Sciences, 22, 241–257.
- Canguilhem, G. (1991).The Normal and the Pathological. Zone Books, New York.
Tom Collura
Ph.D., MSMHC, QEEG-D, BCN, NCC, LPCC-S, Founder
One Study at a Time
Thomas F. Collura, Ph.D., MSMHC, QEEG-D, BCN, LPCC-S (Note on construction: this post was drafted with Claude.ai under the author’s direction, from the BrainMaster research
The Instrument behind the Evidence
BrainMaster Technologies · EEG · qEEG · Neurofeedback The instrument behind the evidence. For more than 25 years, BrainMaster has been a standard for research,
Probing the Priorities of the Brain, Part II: The Column as a Tuned Receiver
Thomas F. Collura, Ph.D., MSMHC, QEEG-D, BCN, LPCC-S (Note on construction: this post was drafted with Claude.ai under the author’s direction, from the author’s earlier