Low-Resolution Electromagnetic Tomographic Analysis (LORETA) is a general approach to computing what is going on inside the brain, based on the surface measurements we get from typically 19 channels of scalp EEG. There is a family of derivative methods (VARETA, bc-VARETA, sLORETA, eLORETA, swLORETA, etc) that use this method with various modifications to improve accuracy, resolution, and speed. Generally all of these methods compute the same thing, which is the current-source density in a small volume of brain, called a “region.” The current-source density reflects the neuronal activity at that location, in the form of the postsynaptic membrane potentials generated by neurons while they communicate and do their work.
Basically, when specific neurons are being activated or de-activated, there is an external electrical current produced, so these neurons are sources of current. The more activity there is in a given region, the higher the current-source density. It’s that simple.
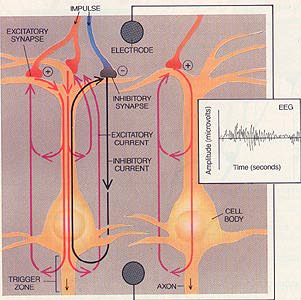
What is important in this regard is that the cortical layers are complex, and allow one region to do more than one thing, either in sequence, or at once. This is the basis of the EEG frequencies see in different bands, be they delta, theta, alpha, beta, or gamma. In other words, by knowing which are the dominant bands in a given region, we know what the region is doing. This is especially important in networks, which bind at a characteristic frequency, such as alpha for the default mode network (DMN).
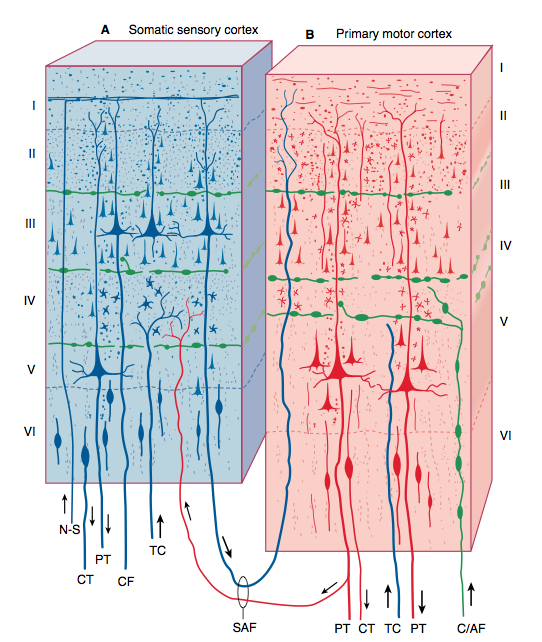
How can we determine what the dominant activity is in any region? The answer can come in the form of relative power. This is a basic metric that has been used in QEEG for decades, but it takes on particular importance in LORETA-based methods. We expect a mixture of frequencies on the scalp, because the volume conduction smears and combines information from many regions into one scalp electrode location. But with LORETA methods, we are calculating what is happening in one spot in the brain, and that should be much more limited in how much can be going on. A given area of the cortex has just so much freedom to do different things at once, and it will tend to be busy with one thing a time, as the brain goes through its microstates and processing sequences. Here we see an example connection between two areas of the cortex, one sensory, the other motor. Through the complex interconnections, these regions communicate with each other using various pathways and frequencies, ranging from slow delta, all the way through fast gamma, and everything in between. But what is any region doing right now, it is important to ask.
QEEG’ers all know about relative power surface maps, and how they can help or hinder interpretation. Basically, they compare the total frequency “pie” with the size of each slice, to show how the surface maps look in a relative way.
The simple answer is that if we can see the relative amount of energy in each band in each region, we can determine what is the priority of that brain region at that instant. This goes beyond simply measuring absolute power, which answers the question “what is going on” and supplements it with the answer to the question “what is important now”. The different cortical layers participate differently in these communications, so knowing what frequency band is dominant in any region can tell us what type of processing it is involved with at this instant, and the networks that are communicating on a particular frequency will emerge as complex areas illuminated by imaging the relative power in any band.
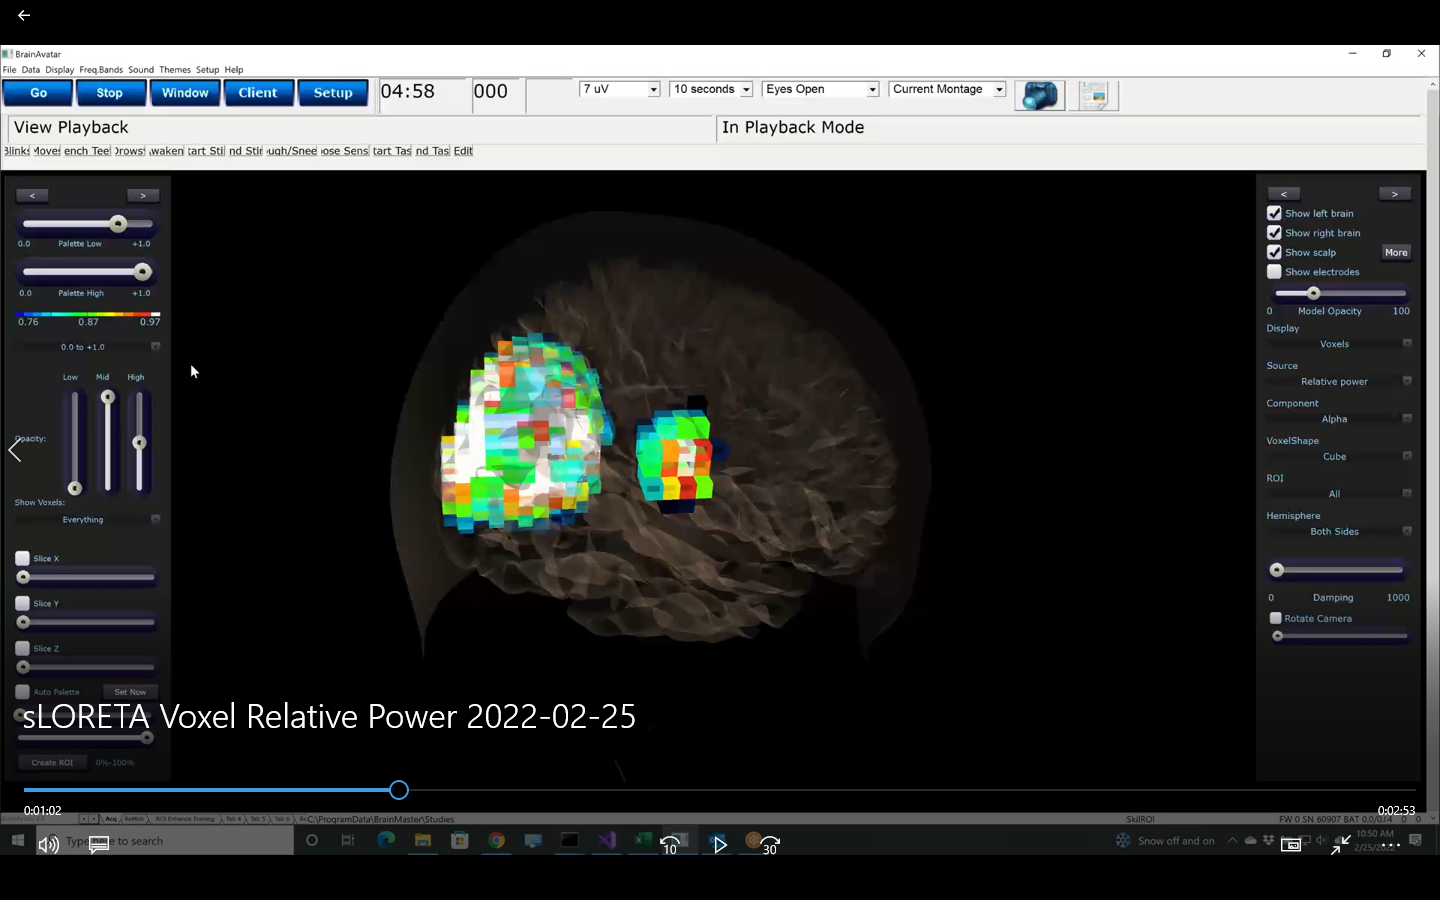
We have implemented relative power in BrainAvatar recently, based on this motivation, and can produce informative maps of both surface EEG, and more importantly, for every voxel in the sLORETA or eLORETA projections we now support. The results are fascinating and informative.
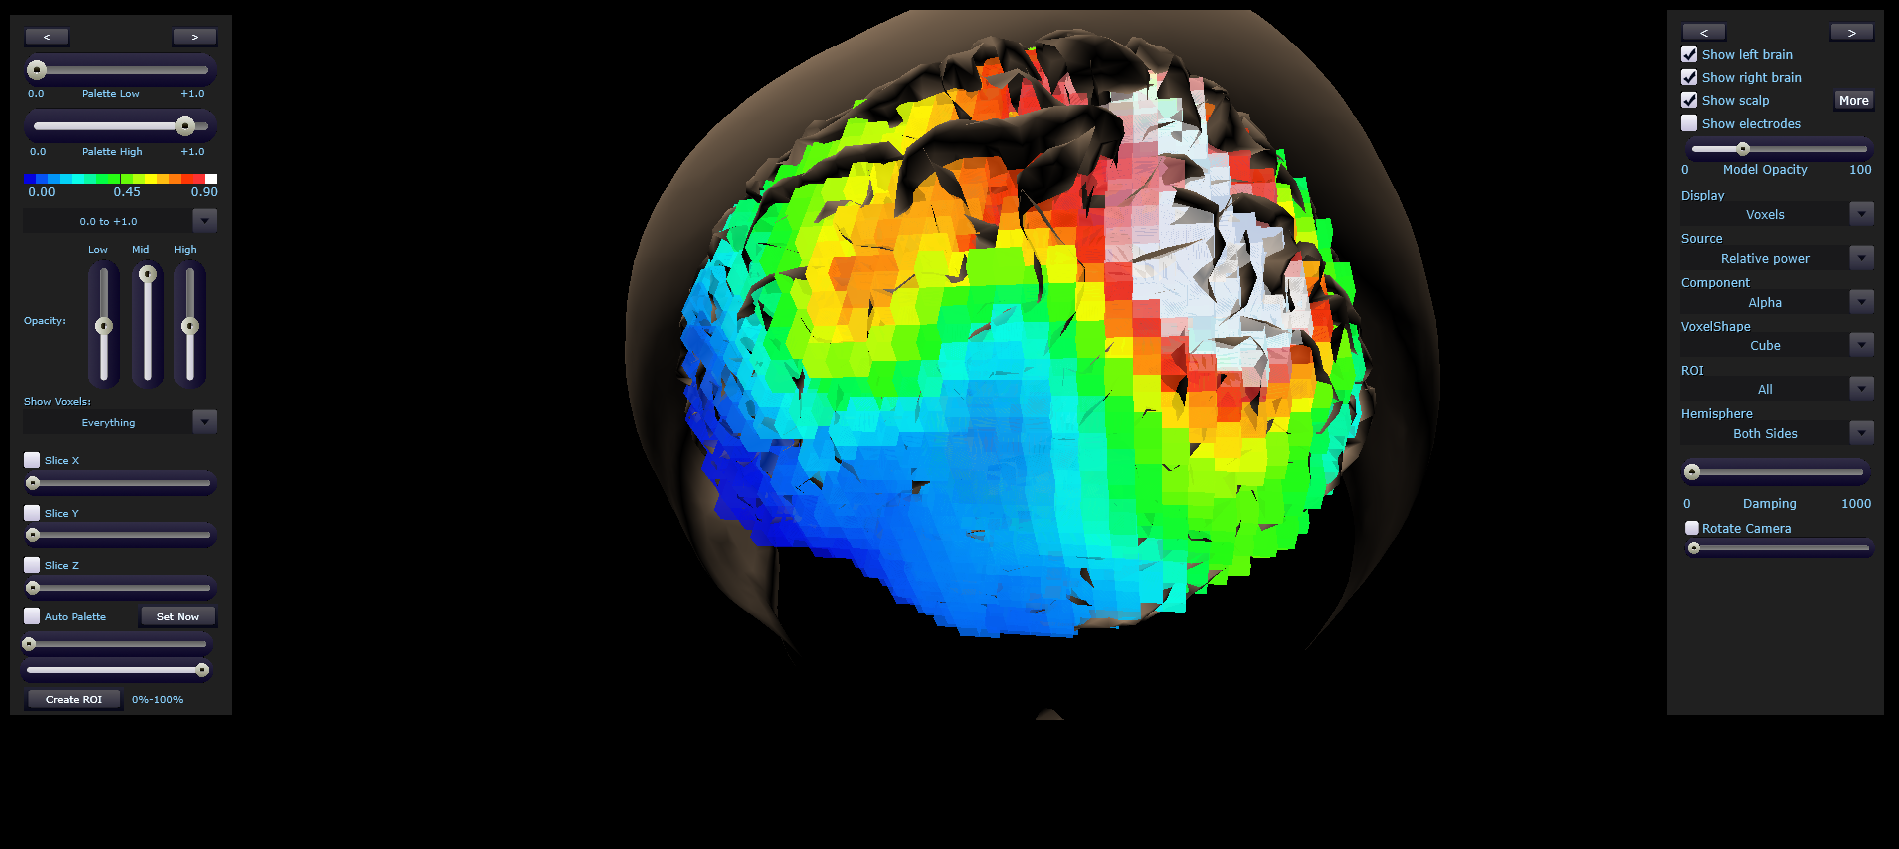
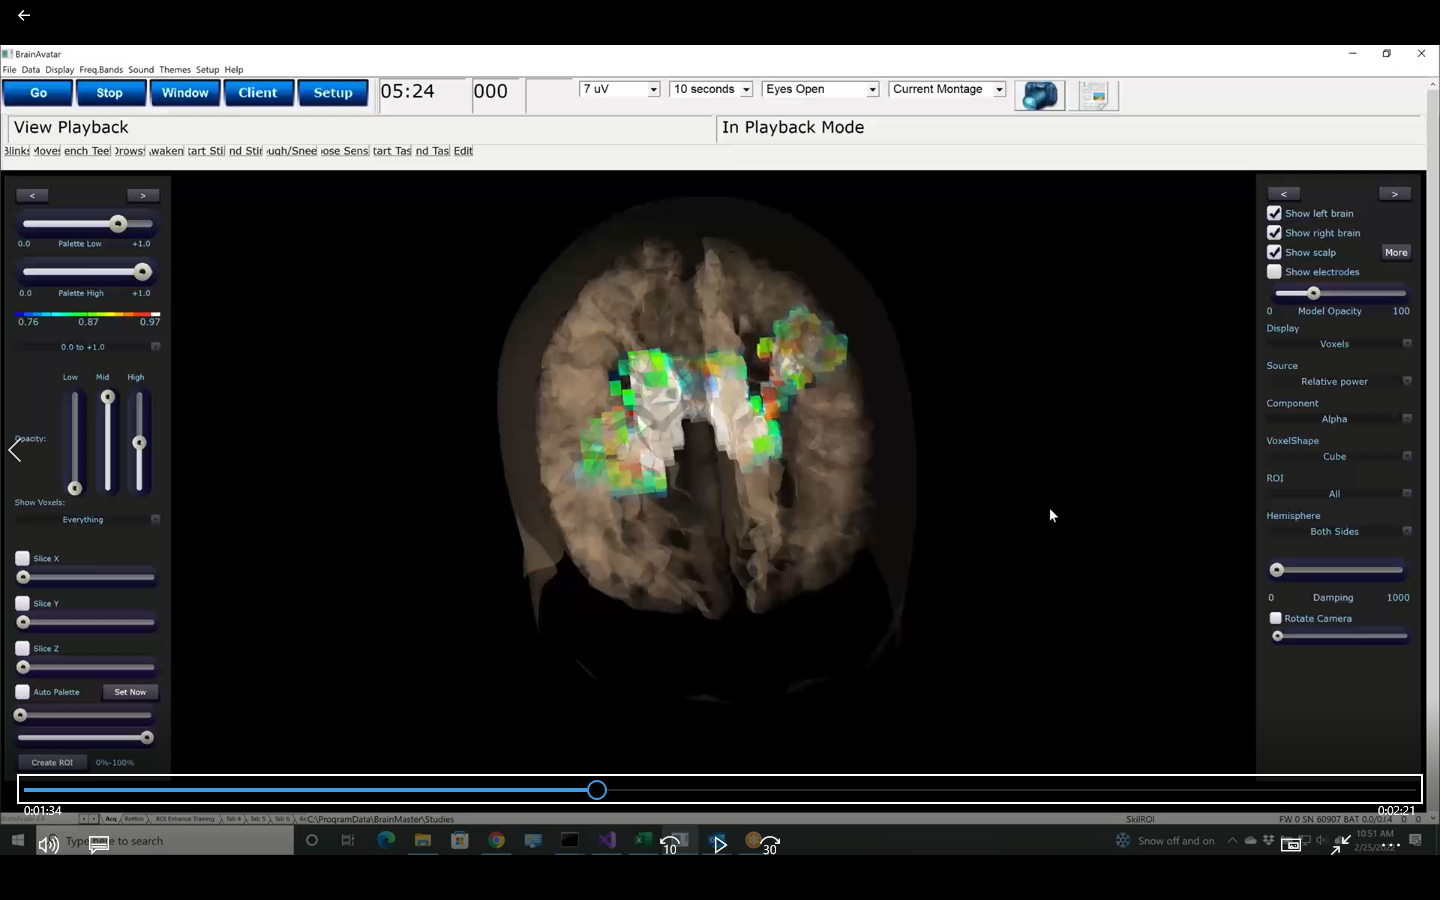
sLORETA and eLORETA relative power give new detailed maps of which regions are spending more of their energy at any band of interest, such as alpha. In this image, only regions who have a significant fraction of alpha activity light up, and the white regions are 90% or more in pure alpha. Networks emerge, at the instant that they are active. Complex and rapid microstate shifts become visible, instantaneously. And these metrics can be used for neurofeedback as well as for assessment and progress tracking.
Networks emerge and disappear instantaneously, reflecting the phase locking and phase release with each use of the network
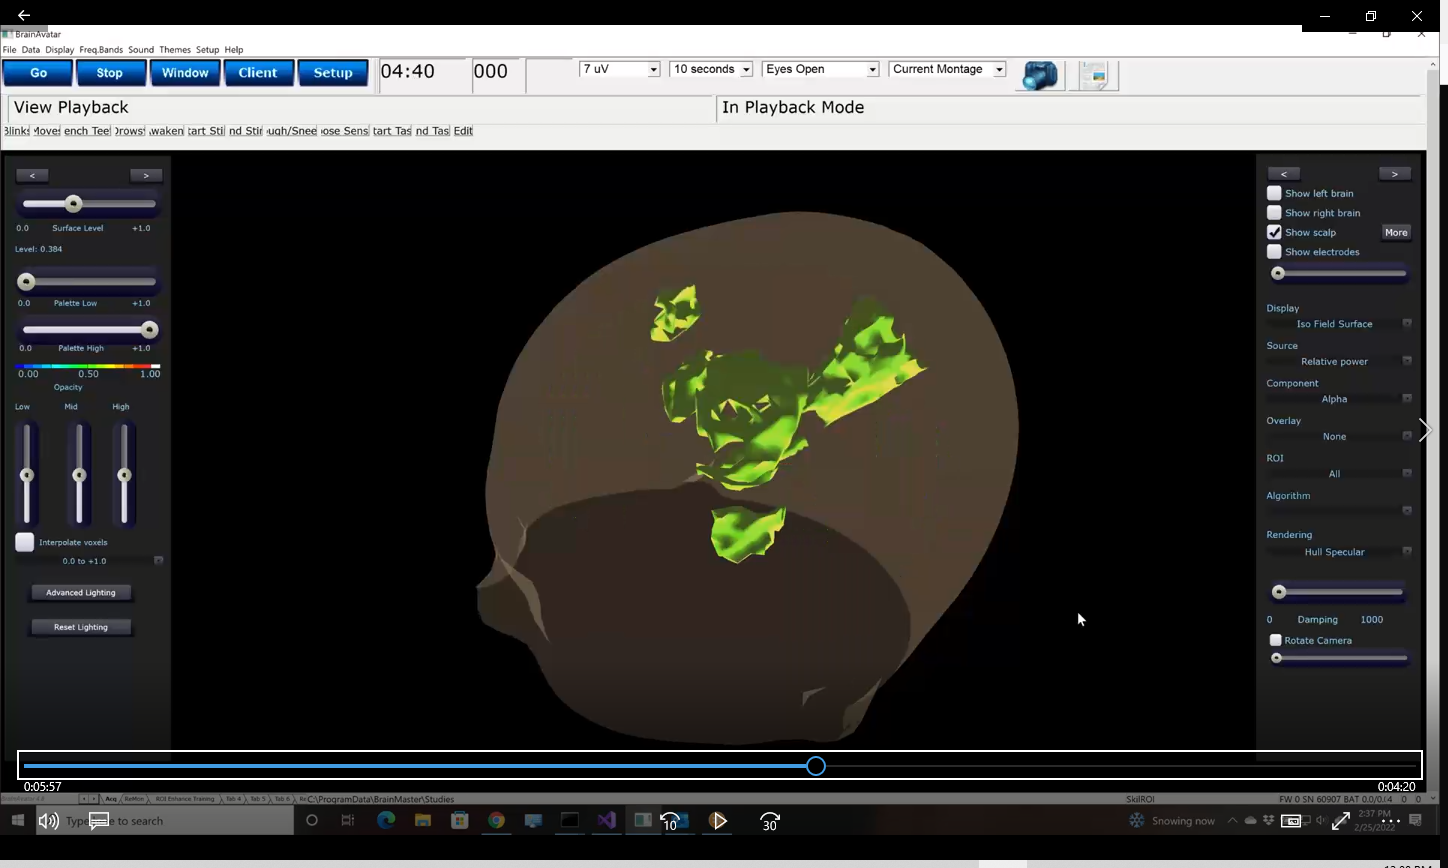
Our new “isofield” solid rendering converts regions of activity into intuitive solid shapes, providing clear and precise indication of brain activity instantaneously.
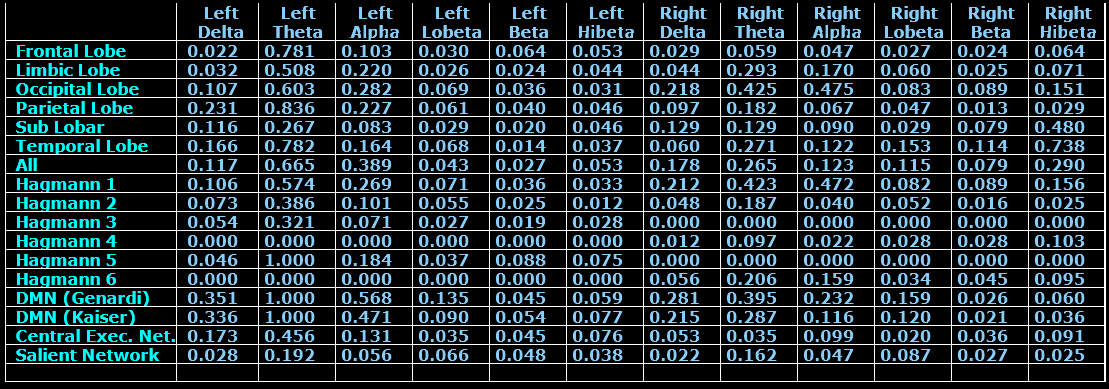
Here is a text display of sLORETA relative power for brain regions and hubs, showing how much priority each region or hub is giving to each frequency band. New information with new insights and new uses.
sLORETA and eLORETA relative power open up new possibilities for QEEG and neurofeedback. BrainAvatar continues to lead the way, implementing new and effective methods, building on what has been learned, and moving toward what we still have to learn.