There is a new generation of EEG analysis tools coming into use, and the BrainMaster designed Brain Panel is an example of a new method for fast screening of EEG’s. It is now incorporated as part of the STS EEG Screening service, which also includes a signed report by a board certified M.D. neurologist.
We are teaching the computer how to “look at” an EEG and compare it with a large sample of others, to see how it compares. It is not “normative” in that it is compared with clinical samples, not “normals.” The purpose of our system is to pre-screen EEG’s that have not yet been inspected or artifacted, to determine how well they fit into a “typical” type of recording, as well as identifying phenotypes that may be evident. This report can provide a heads-up of what to look for when proceeding to look at the EEG for purposes of clinical referral, or to prepare the recording for QEEG analysis. This is therefore, a “pre-Q” or even a “pre-pre-Q”. We have further enhanced the system to provide a report composed and formatted to replicate the physician’s quality review. We are thus able to determine how well this method actually produces a useful report, based on the quantitative findings derived from the metric analysis.
This can be thought of as similar to the familiar blood test panels, which provide an array of information related to blood health, compared to a clinical population. A clinician can review a blood panel with a client, explaining the importance of each finding. The Brain Panel performs a similar role, but uses properties extracted mathematically from the EEG waves, in place of the chemical analysis used in a blood test. This report contains measurements relevant to the overall quality of the EEG recording, as well as the presence of deviations that may have possible clinical significance. A clinician can share the Brain Panel with a client, and help them understand what significant findings are present, based on the automated analysis of the brain wave data.
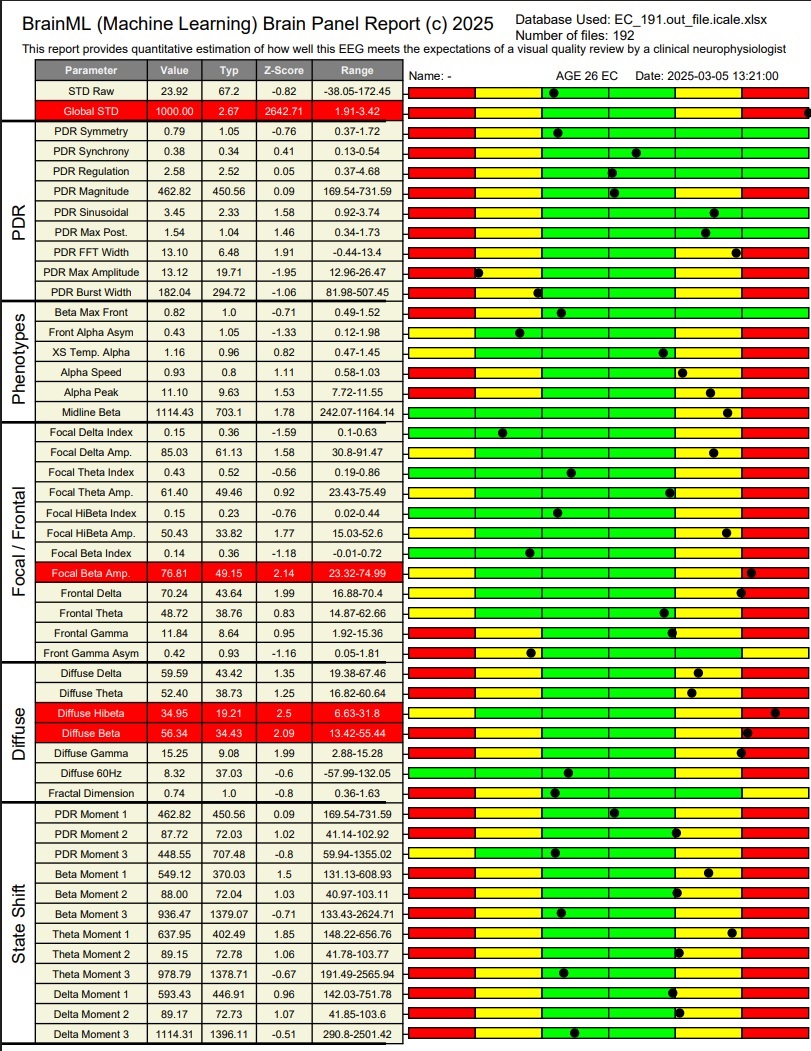
A summary of relevant detected deviations is also provided:
TECHNICAL BACKGROUND
We equip the computer with a program that is designed to use digital signal processing in order to simulate what a doctor does when they do a visual inspection of an EEG. We pick the rules, and do not allow the machine to make decisions about which metrics or derived computations are used. We define a set of reasonably informed metrics motivated by the concepts of the posterior dominant rhythms, amplitude foci and magnitudes, time course of various metrics, and so on. An ICA is applied to remove eye artifact. We analyze a series of 10-second epochs, providing a 0.1 Hz resolution for the FFT. This clearly shows the frequency content, up to 64 Hz. We then present the program with a number of EEG’s (currently in the hundreds) allow it to compute the population statistics of the input samples. In this regard it is similar to QEEG.
We select EEG’s simply by the fact that they were submitted by a client subscribing to an EEG quality review service, and reported on by a board certified clinical neurophysiologist/QEEG Diplomate, in consultation with 1 or 2 board certified QEEG diplomates. The purpose of the doctor’s report is to comment on the quality of the EEG submitted, and make any relevant clinical observations regarding severe abnormalities, or EEG quality problems. Therefore, this is not a “normative” database, but rather one that represents what is seen in a clinical EEG service, and analyzed with regard to what a visual inspection of the EEG might state.
We constructed reference databases from two sets of data, which have samples sizes of 95 and 190 respectively. We observed that the larger database produces slightly wider acceptance bands, but does not affect the resulting z-scores.
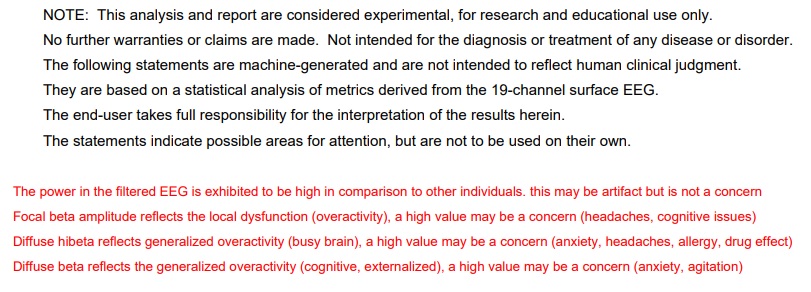
NOT AI
This system provides automated screening of EEG’s, but it is not AI. With AI, a computer learns to recognize patterns based on presented information. This method uses predefined criteria based on years of experience with EEG, and the design of the software has been guided by an experienced scientist who defines the analysis used. Then, by applying the analysis to hundreds of EEG’s, the system learns what is typical and what is not typical, and precisely how deviant any findings are. It is thus useful for tracking changes, or seeing the effects of tasks, or other changes or interventions.
NOT QEEG
Although it uses z-score to quantify EEG properties, it is not QEEG. We do not rely on maps or complex graphs, and we do not attempt to compare to a “normal” population. This is an automated EEG quality analysis, pure and simple.
As a form of quality control, and as an assist to a clinical neurophysiologist, this system provides a level of automation that eases the burden when reading eeg’s on a routine basis. This is a tool that provides an aid to visual inspection, but does not replace any of the human tasks required for sound EEG analysis, or preparation for further processing. In addition to metrics reflecting relative amplitudes and distributions of key metrics, the report analyzes “moments” which reflect the total size of a component amplitude, as well as its distribution within and across the recording session. Extreme moments tend to reflect drowsiness and other changes across a recording, showing changes across time. These are similar but not identical to reliability measures such as split half and test-retest reliability.
This is an example of a machine-generated report in the format of a clinical EEG quality review, entirely produced without human intervention, as an automated screening tool for EEG. All EEG’s submitted to stseegscreening.com will be given this analysis as part of the routine clinical quality inspection procedure and reports. (Patents applied for)
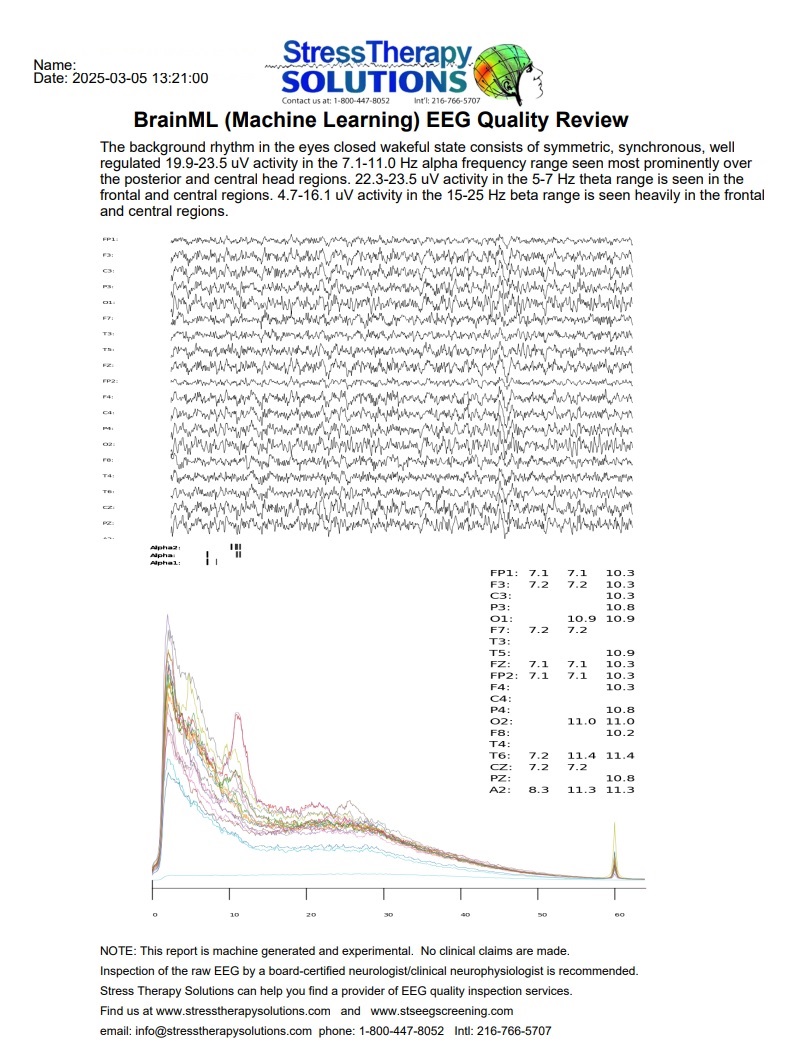
EXAMPLE MACHINE GENERATED REVIEW SUMMARY
for further information, see: https://stresstherapysolutions.com/eeg-screening-review/