EEG as a Predictor of Medication Response:
An Updated Review and Analysis
Thomas F. Collura
Original Paper: February 2012
Updated: December 2025 (in collaboration with Claude.ai)
Abstract
This report examines the evidence that the human electroencephalogram (EEG) can be used to help predict medication response in clients with mental health concerns. This updated review incorporates research published since the original 2012 paper, with particular attention to developments in machine learning approaches, large-scale clinical trials (iSPOT-D, EMBARC, iSPOT-A), the FDA approval and subsequent controversy regarding the NEBA system for ADHD diagnosis, and emerging concepts in precision psychiatry. The focus remains on depression and ADD/ADHD, while extending to new methodological developments including aperiodic EEG activity as a biomarker. Meta-analyses and systematic reviews published since 2012 provide a more nuanced understanding of the clinical utility of EEG biomarkers, revealing both promise and significant limitations in current approaches. The ultimate question remains whether EEG can be used clinically to help select the most appropriate medications for individual patients, and this updated review suggests that while significant progress has been made, substantial challenges remain before widespread clinical implementation becomes feasible.
EEG as a Predictor of Medication Response
This report examines the evidence that the human electroencephalogram (EEG) can be used to help predict medication response in clients with mental health concerns. The focus of this review is depression, which is typically treated with antidepressants, and ADD/ADHD which is commonly treated with stimulants. The ultimate question to be asked is, “can EEG be used clinically to help to select the most appropriate medications for a client?” These questions are addressed by examining the published literature in this area, specifically controlled studies that look at specific EEG parameters and how they relate to medication response in mental health patients. The report will describe some of the basic brain mechanisms that are accessible to the EEG, and how they relate to mental disorders. I will then review research articles that evaluate EEG parameters in particular patient populations, and determine how these parameters relate to how patients respond to medications for their disorders. In certain patient populations, recognizable EEG parameters or patterns could be used as useful guides in determining how a given individual will respond to a particular medication. This is the element of prediction. As a second question, the possible value of EEG in selecting medications in a clinical setting will be addressed. This question focuses on the issue of whether clinical decisions can be positively impacted by considering EEG data, and is this data of demonstrable value in designing a medication plan for a given patient. Prediction should have particular value in determining nonresponders, or those prone to abreaction. Thus, by screening them at the outset, and simply not administering adverse substances to these patients, efficacy and safety statistics would rise, and the likelihood of success with any given medication would increase.
I have chosen this topic because I have a long-standing interest in EEG, and have been active in research and publication in this area for several decades. However, my work has been primarily in epilepsy and in neurofeedback. Very little of my background relates to psychoactive medications. This study is intended to help provide directly applicable information that can be used clinically in the practice of mental health counseling and consulting. The ability to more objectively manage medications is significant because a considerable amount of modern pharmacology consists of selecting drugs based upon diagnosis or symptoms, and then using a medication on a trial basis. This can lead to the need for successive or combined pharmacology, in the face of treatment failures, abreactions, or noncompliance. It is hoped that this approach can lead to a useful contribution to clinical psychopharmacology in the context of a mental health counseling practice.
This report is intended to help clinicians predict how clients will respond to proposed medications, and help to avoid some of the trial-and-error method now used. This will allow clients to achieve benefits sooner and with less risk of abreactions or side-effects, by using the most appropriate medications in the shortest time frame. One of the author’s first such experiences with a neurofeedback client was an individual who had abreacted to an SSRI, becoming agitated and unable to continue in school. A subsequent EEG analysis revealed a pattern known to indicate an SSRI non-responder. Specifically, this finding included the commentary, “some central Beta spindling, although it does not appear to be excessive in the averaged spectra due to the intermittent nature,” “associated with the COMT gene expression (COMT=0) which predicted a poor SSRI response (even some side-effects of over-arousal).” If this individual had been given this EEG-based analysis initially, the abreaction to the SSRI could potentially have been avoided.
Developments Since 2012
Since the original version of this report was written in 2012, substantial developments have occurred in this field. Large-scale, multicenter clinical trials including the international Study to Predict Optimized Treatment in Depression (iSPOT-D) and the Establishing Moderators and Biosignatures of Antidepressant Response in Clinical Care (EMBARC) study have provided unprecedented data on EEG biomarkers in depression. The iSPOT-D study enrolled over 1,000 patients across 22 sites in 5 countries, randomizing participants to three different antidepressants, while EMBARC provided a placebo-controlled design with comprehensive neuroimaging assessments. These studies have generated datasets that continue to be analyzed using increasingly sophisticated computational approaches.
In July 2013, the FDA approved the Neuropsychiatric EEG-Based Assessment Aid (NEBA) system for assisting in ADHD diagnosis, representing the first regulatory approval of an EEG-based psychiatric assessment tool. This approval generated significant attention but also substantial controversy, as subsequent research and professional guidelines have raised significant questions about its clinical utility. The American Academy of Neurology published a Practice Advisory in 2016 recommending against routine clinical use of the theta/beta ratio for ADHD diagnosis outside of research settings.
Machine learning approaches have emerged as a powerful tool for identifying complex patterns in EEG data that may predict treatment response. Deep learning methods, including convolutional neural networks and graph neural networks, have achieved substantially higher prediction accuracy than traditional band power analyses, though questions remain about generalizability and clinical implementation. The field has also witnessed the emergence of precision psychiatry as a conceptual framework, emphasizing the need for individualized treatment approaches based on biological markers rather than symptom-based diagnosis alone.
Additionally, new methodological developments have expanded the EEG features available for analysis. The distinction between periodic (oscillatory) and aperiodic (1/f-like) components of the EEG power spectrum has received increasing attention, with the aperiodic exponent proposed as a marker of cortical excitation/inhibition balance. Advances in source localization methods, including eLORETA and related techniques, have enabled more precise localization of EEG activity to specific brain regions. Connectivity analyses examining functional relationships between brain regions have supplemented traditional power spectral analyses.
Goals and Objectives
The goals of this updated report are to: Review the literature describing EEG in relation to medication response, with particular attention to studies published since 2012. Review the literature regarding the value of EEG in psychiatric medication management, including meta-analyses and systematic reviews that provide quantitative synthesis of the evidence. Review the underlying principles of the EEG and which brain mechanisms it can indicate, including newer concepts such as aperiodic activity and connectivity measures, and how EEG can relate to the major mental health disorders of depression and ADD/ADHD. Evaluate the current status and prospects for the use of EEG in this manner, in the clinical environment, including recent developments in machine learning and precision psychiatry, and evaluate the possible impact or value for mental health counseling.
Literature Review
Sufficient literature exists demonstrating that EEG is sufficiently relevant to mental health concerns to provide a useful indicator of medication response. There are also studies relating to use of EEG to select medications, and its possible value. The literature base has expanded considerably since 2012, with several large-scale clinical trials and meta-analyses providing more robust evidence regarding the predictive value of various EEG biomarkers.
Studies have been published describing EEG patterns in mental health, and how they relate to mental disorders (Arns, Gunkelman, Olbrich, Sander, & Hegerl, 2011; Hegerl, Stein, Mulert, Mergl, Olbrich, Dichgans, et al., 2008; Suffin & Emory, 1995). Studies have been published on how different EEG parameters and patterns can be used to predict drug response (Bares, Brunovsky, Kopecek, Novak, Stopkova, Kozeny, et al., 2007, 2008; Bruder, Sedoruk, Stewart, McGrath, Quitkin, & Tenke, 2008). Further studies have specifically examined the value of using EEG in a clinical practice, as a resource for information relevant to medication selection (Arns, Gunkelman, Olbrich, Sander, & Hegerl, 2011; DeBattista, Kinrys, Hoffman, Goldstein, Zajecka, Kocsis, et al., 2010; Hermens, Rowe, Gordon, & Williams, 2006).
More recent large-scale studies including iSPOT-D (Williams et al., 2015) and EMBARC (Trivedi et al., 2016) have provided extensive data from multicenter trials. Meta-analyses by Widge et al. (2019) and Zhdanov et al. (2022) have synthesized findings across multiple studies, though their conclusions regarding clinical utility have been more cautious than earlier single-study reports. The NeuroPharm validation study (Ip et al., 2021) attempted to independently validate previously reported biomarkers and found only partial support, highlighting the challenges of replication in this field.
Underlying Principles
The underlying brain mechanisms that are shown in the EEG have potential relevance to psychiatry and to psychopharmacology (Johnstone & Lunt, 2011). For example, the frontal areas are known to mediate high-order mental processes such as planning, judgment, emotion, and decision-making. The cingulate gyrus, which lies in the middle of the cortex and connects widely to other areas, is involved in attentional control, setting priorities, and shifting of focus from one task or topic to another. The temporal and posterior areas, involved in visual and auditory sensation and processing, are involved in sense of self, audiovisual and spatial integration, and memory processes.
Sterman, Mann, Kaiser, and Suyenobu (1994) used EEG studies to identify and articulate a model based upon the concept of the “concentration/relaxation” cycle that appeals to the notion that brain functional areas must alternate between periods of activity and periods of rest. Sterman (1996) further described how this relates to self-regulation as revealed by the modulation of EEG rhythms. This is not the same as the entire organism’s diurnal cycles of activity and rest, and occurs on much shorter time frames, of 10 or 20 seconds. For example, when pilots are performing a controlled task, Sterman found that effective performance is predicated on a natural alternation between a low-amplitude, high-frequency Beta state, and a high-amplitude, low-frequency Alpha state. Effective performers exhibited a natural, fluid, and flexible alternation between states. These individuals were able to regulate attention, perform, recover, and repeat tasks with significantly less difficulty or fatigue than others.
When the concentration/relaxation model is applied to specific brain locations, it becomes a way to understand diagnostic categories as sets of functional dysregulations, not simply constellations of symptoms. For example, if “little Johnny’s” posterior cingulate is stuck in a Beta state, it is functionally “offline” and will not perform its function in co-ordination with the rest of the brain. Therefore, the rest of the brain is not being told when to let go of something of attention, so that attention has a chance to switch to something else. This will lead to his being “stuck” on particular objects of attention, be inflexible, and consequently, quite possibly angry and defiant. An intervention that begins by focusing on this type of functional block will presumably be able to identify interventions that are relevant to the fact that little “Johnny’s” posterior cingulate is offline in a Beta state, rather than the fact that he is angry, defiant, and has an attention problem.
Arns, Gunkelman, Olbrich, Sander, and Hegerl (2010) developed and applied a model based upon a time-series of vigilance states that could be associated with particular EEG patterns. Based on their analysis, there is a specific sequence of states that the individual, and his or her EEG, undergo in moving from a highly alert state into a less alert, or even a sleep, state. This transition is characterized by shifts from a state of high occipital Alpha power to one of more frontal Alpha, then a desynchronized (low amplitude) state, and finally, Theta, Delta, and “spindling” sleep. By appealing to this sequence, they were able to identify dysregulations of two types. One, “rigid” regulation, is characterized by a lack of modulation, and continual wakefulness, which corresponds to activation in the previous analysis. The other form of dysregulation is “labile” regulation, and is characterized by a proclivity to slow-waves and a de-activated state.
Hegerl et al (2008) further refined this into a model that sees ADD/ADHD as a disorder with the two subtypes, hyperactive and inattentive, arising from a vigilance autostabilization syndrome, or from impaired sustained attention, respectively. That is, when a child is hyperactive, it is because he or she is in a continual state of vigilance. When inattentive, the child has an impaired ability to sustain attention, which is in some ways the opposite of vigilance. The ability to distinguish children along this axis, rather than purely by behavioral indicators, has the potential to enable an individualized approach to diagnosing and treating each child.
There is a philosophical basis to this approach, in that the physiological substrate of a mental or emotional disorder may have a discernable deviation from normal, and that this deviation may be observable in the EEG. By using physiological factors instead of, or in addition to, the diagnosis or symptoms, a more functional view of the patient can be obtained. Based upon this functional understanding, the mechanisms of medication use, and the likelihood of particular medications being effective, can be determined. This becomes a form of individualized therapy, in which patients are assigned to medications based upon functional knowledge of their brain physiology, not just their diagnosis or symptoms.
Aperiodic Activity: A New Biomarker Paradigm
Since the original publication of this report, a significant methodological development has emerged in the form of aperiodic EEG activity analysis. Traditional EEG analysis has focused on periodic (oscillatory) activity in canonical frequency bands such as theta (4-8 Hz), alpha (8-12 Hz), and beta (12-30 Hz). However, the EEG power spectrum also contains an aperiodic component, characterized by a 1/f-like spectral slope that decreases with frequency. This aperiodic component, often quantified as the spectral exponent or slope, has been proposed as a biomarker for various psychiatric and neurological conditions.
Donoghue et al. (2020) developed the specparam algorithm (formerly known as FOOOF, Fitting Oscillations and One-Over-F) for parameterizing neural power spectra into periodic and aperiodic components. This methodological advance has enabled researchers to distinguish between true oscillatory changes and shifts in the broadband aperiodic component. Previously, what was interpreted as increased “theta” power might actually reflect a flattening of the overall spectral slope rather than a specific increase in theta oscillations. This distinction has important implications for interpreting EEG findings and relating them to underlying neural mechanisms.
The aperiodic exponent has been interpreted as reflecting the balance between cortical excitation and inhibition (E/I balance), with a flatter slope (smaller exponent) potentially indicating increased excitation relative to inhibition. Converging evidence from computational modeling, pharmacological studies, and clinical research supports this interpretation. For example, GABAergic medications that enhance inhibition tend to steepen the spectral slope, while conditions associated with hyperexcitability show flatter slopes.
In ADHD research, Robertson et al. (2019) and Ostlund et al. (2021) found that children with ADHD show a flatter power spectral slope compared to typically developing controls. Importantly, this relationship appears to be moderated by stimulant medication history, with untreated adolescents with ADHD showing the most pronounced differences. Arnett et al. (2022) reported that the aperiodic exponent shows good to excellent internal consistency and may serve as a more reliable biomarker than traditional theta/beta ratio measures, which have shown inconsistent results across studies.
The clinical significance of aperiodic activity extends to medication response prediction. Pertermann et al. (2019) found that the aperiodic exponent increased following optimized methylphenidate treatment in school-aged children with ADHD, and this change correlated with improved behavioral performance. This suggests that the aperiodic exponent may serve as a pharmacodynamic biomarker for tracking treatment effects in real-time, potentially identifying responders earlier than traditional clinical assessments. Research has also examined aperiodic activity in depression, finding that changes in the spectral slope may track symptom severity and treatment response.
The distinction between periodic and aperiodic activity has important implications for interpreting earlier research. Many prior findings attributed to changes in specific frequency bands may have been confounded by shifts in the aperiodic component. As Lansbergen et al. (2011) noted, the increased theta/beta ratio in ADHD may be largely driven by a slow alpha peak frequency rather than a specific excess of theta oscillations. Similarly, the relationship between theta power and antidepressant response may partly reflect changes in the aperiodic component rather than true theta oscillations. Future research should routinely parameterize EEG spectra to distinguish these contributions.
ADD/ADHD
In the pharmaceutical treatment of ADD/ADHD, the fundamental questions to be answered are, does a particular child have ADD/ADHD, and will he or she respond favorably to a proposed medication. The first question addresses the concern about overdiagnosis of ADD/ADHD, and the second question addresses the advisability of using medications on those who are deemed in need of it. A consideration of contributory factors including environment, upbringing, family dynamics, diet, exercise, and school environment should also contribute to the evaluation. If medication is to be used, it is important to determine early whether the individual will respond to proposed medication, and what is the likelihood of abreactions or side-effects, particularly in the case of depression (Schatzberg, Cole, & DeBattista, 2010).
With regard to ADD/ADHD, in the NIMH-MTA trial, a large, multicenter study of different treatments for ADD/ADHD, there was no long-term benefit seen for the use of stimulant medication, beyond 2 years. It was not possible to separate those who took stimulants from those who did not, using behavioral and observational measures as the children matured (Swanson et al., 2007). In addition, the overall rate of nonresponse was estimated at 30%, indicating that 1 in 3 children given stimulants did not benefit, but was still exposed to risks (Hermens, Rowe, Gordon & Williams, 2006). These findings underscore the importance of developing biomarkers that can identify likely responders before initiating treatment, thereby reducing exposure to ineffective medications and their associated side effects.
Specific EEG correlates of ADD/ADHD are well established. One of the most prominent early observations was that overall Theta activity (4-7 Hz) appears increased in the ADHD population (Chabot & Serfontein, 1996; Mann, Lubar, Zimmerman, Miller & Muenchen, 1992). Increased Delta (1-3 Hz) activity has also been observed (Bresnahan et al., 1999; Matsuura et al., 1993). Williams et al. (2010) analyzed the EEGs of 275 ADHD patients, and found increased Theta (p < .0001) and decreased relative Beta power (p < .0001) when compared to a matched control group. Lubar (1991) developed the use of the EEG ratio of Theta/Beta power, and established it as a discriminant that could be used to separate normal children from children with ADD/ADHD or learning disorders.
FDA Approval of the NEBA System and Subsequent Controversy
In July 2013, the U.S. Food and Drug Administration approved the Neuropsychiatric EEG-Based Assessment Aid (NEBA) system, marking the first regulatory approval of an EEG-based device for assisting in psychiatric diagnosis. The NEBA system calculates the theta/beta ratio from a single electrode at position Cz and is indicated for use in patients aged 6-17 years as an adjunct to clinical evaluation for ADHD. The FDA emphasized that NEBA “should only be used by a clinician as confirmatory support for a completed clinical evaluation or as support for the clinician’s decision to pursue further testing” and is “NOT to be used as a stand-alone in the evaluation or diagnosis of ADHD.” The 15-20 minute non-invasive test provides an objective measure that can supplement traditional clinical assessment.
The pivotal study supporting FDA approval (Snyder et al., 2015) enrolled 275 children and adolescents presenting with attention and behavioral concerns at 13 clinical sites. Participants underwent comprehensive clinical evaluation by qualified clinicians, and their diagnoses were compared with those of a blinded multidisciplinary expert team. The study reported that integration of NEBA with clinical evaluation could improve diagnostic accuracy from 61% to 88%. Importantly, the primary utility appeared to be in identifying patients less likely to have ADHD (reducing overdiagnosis) rather than confirming ADHD diagnosis. Patients with relatively lower theta/beta ratios were more likely to have conditions other than ADHD, including anxiety, mood disorders, learning disabilities, and other conditions that can mimic ADHD symptoms.
However, the FDA approval generated significant controversy in the field. In 2016, the American Academy of Neurology published a Practice Advisory based on a systematic review of the evidence (Gloss et al., 2016). The advisory concluded that “clinicians should inform patients with suspected ADHD and their families that the EEG theta/beta power ratio should not be used to confirm an ADHD diagnosis or to support further testing after a clinical evaluation, unless such diagnostic assessments occur in a research setting.” This recommendation was designated as Level R (indicating rejectability) based on analysis of available Class I evidence.
The AAN review identified two Class I studies that assessed the ability of theta/beta ratio and frontal beta power to identify patients with ADHD, which correctly identified 166 of 185 participants (89-94% accuracy). However, the advisory noted several concerns. First, the clinical utility beyond standard evaluation remained undemonstrated—there was no evidence that adding EEG testing improved patient outcomes compared with clinical evaluation alone. Second, the risk of misdiagnosis (6-15%) when using theta/beta ratio was considered clinically significant. Third, the NEBA validation study methodology had limitations, including lack of intention-to-treat analysis and potential circularity in defining response to ADHD medication as a diagnostic criterion.
Arns et al. (2013) conducted a meta-analysis examining the theta/beta ratio across studies spanning a decade of research. While confirming that a substantial subgroup of ADHD patients shows elevated theta/beta ratio compared to controls, they noted that the effect size had decreased over time (from 0.75 to 0.62 with increasing age of participants). This decline was explained by an increase in theta/beta ratio for non-ADHD control groups over time, potentially reflecting changes in ADHD diagnostic practices and the increasing heterogeneity of study populations. They concluded that excessive theta/beta ratio is not a reliable diagnostic marker for ADHD at the individual level, though it may characterize a specific subgroup of patients.
The controversy highlights an important distinction between diagnostic and prognostic biomarkers. While theta/beta ratio may have limited value for confirming ADHD diagnosis, it may be more useful as a prognostic biomarker for predicting treatment response. Suffin and Emory (1995) originally reported that 95% of children who exhibited excess theta responded to stimulants. More recent work by Arns et al. (2008) demonstrated that EEG phenotypes were predictive of stimulant outcome. The theta/beta ratio appears to identify a hypoarousal subgroup for whom stimulant medication may be particularly effective. This prognostic application represents a different use case from diagnostic classification.
The International Study to Predict Optimized Treatment for ADHD (iSPOT-A)
The iSPOT-A study represents one of the largest prospective trials examining EEG biomarkers as predictors of methylphenidate response in ADHD. Arns et al. (2018) reported results from 336 children and adolescents with ADHD (mean age 11.9 years; 245 males) and 158 healthy controls across multiple international research sites. This phase-IV, multi-site, open-label effectiveness trial enrolled participants who were prescribed methylphenidate following standard clinical practice. Treatment response was established after six weeks using the clinician-rated ADHD-Rating Scale-IV, with responders defined by a 25% or greater reduction in symptoms.
Contrary to expectations based on earlier literature, the study found no significant differences between ADHD patients and healthy controls for theta/beta ratio or alpha peak frequency at the group level. This negative finding contradicted decades of prior research suggesting elevated theta/beta ratio as a hallmark of ADHD. The authors noted that this may reflect changes in ADHD diagnostic practices over time, with broader inclusion criteria leading to greater heterogeneity in the ADHD population.
Regarding treatment response prediction, 62% of the ADHD sample was classified as responders to methylphenidate. Responders did not differ from non-responders in age, medication dosage, or baseline severity of ADHD symptoms. Critically, responders also did not differ from non-responders in baseline theta/beta ratio, failing to replicate earlier findings. However, the study did identify the individual alpha peak frequency (iAPF) as a promising biomarker, with lower iAPF associated with non-response to stimulant medication. This effect was particularly pronounced in males, consistent with earlier findings of gender-specific EEG correlates.
These findings have important implications for the field. The failure to replicate theta/beta ratio findings in a large, multicenter trial suggests that earlier single-site studies may have been affected by methodological factors, selection bias, or publication bias. The emergence of individual alpha peak frequency as an alternative biomarker suggests that spectral slowing in the alpha range may be more robust than elevated theta power per se. As Lansbergen et al. (2011) had suggested, the apparent theta elevation in ADHD may be an artifact of slow alpha peak frequency rather than a specific excess of theta oscillations.
Michelini et al. (2022) conducted a comprehensive review of treatment biomarkers for ADHD and reported that iAPF showed predictive gains of 29-36% in blinded, out-of-sample validations for stimulant response. Additional exploratory analyses showed that iAPF predicted remission to guanfacine (high iAPF associated with better response) and atomoxetine (low iAPF associated with better response). These findings suggest that iAPF may help stratify patients to different treatment approaches, though prospective validation studies with randomization based on EEG biomarkers are still needed to establish clinical utility.
EEG Phenotypes and Stimulant Response
The relationship between EEG and stimulant response has been recognized for decades. Satterfield used this approach as early as 1971, and found that excess slow wave activity and large evoked potentials could identify likely responders to stimulant medication (Satterfield, Lesser, & Podosin, 1971; Satterfield et al., 1973). Chabot, di Michele, Prichep, and John (2001) were also able to demonstrate that abnormal EEG could be used to identify those who would have a positive reaction to treatment.
Arns, Gunkelman, Breteler, and Spronk (2008) demonstrated that particular patterns in EEG expression, referred to as “phenotypes,” were predictive of stimulant outcome. They further pointed out that the 20-40% of children with ADHD who do not respond to stimulants could be related to the EEG subtypes. The EEG parameters that they examined were: excess frontal slow, slow anterior peak frequency, excess frontal Alpha, and frontal Beta spindles. These were recognized by visual interpretation, not by an automated QEEG process. The inter-rater reliability was 0.90 or better, indicating consistency in this visual approach.
When EEG phenotypes were compared with treatment effects, several findings appeared. One was that the frontal slow type showed improvement in a CPT task, in the area of false negative errors. Also, the frontal slow group and the slow Alpha peak frequency group showed a similar amount of initial errors, but only the frontal slow group responded to stimulants. It was also found that the EEG subtypes did not correspond well to the ADHD subtypes based upon behavior. This implies that the EEG approach provides a different type of information, and that it is not redundant with existing cognitive or behavioral assessments.
In applying this to drug prediction, the authors recommended that quantitative EEG analysis should avoid using fixed frequency bands, but should clearly distinguish between slowing of the anterior peak frequency, and the presence of frontal slow waves, which look the same to a QEEG, but are visually and functionally different. They also pointed out that this type of classification should not be a simple yes/no decision, but should assess the degree of severity of each phenotype, in each individual. This nuanced approach recognizes that ADHD is a heterogeneous condition with multiple potential underlying mechanisms.
In addition to the excess Theta and slow peak frequency groups, there is a group of approximately 15-20% of children, who have excess “spindling” Beta visible in the frontal areas (Chabot & Serfontein, 1996; Clarke et al., 2001b). Interestingly, this pattern is commonly seen in response to benzodiazepines (Blume, 2006). In the case of children with ADHD, this subgroup is more prone to moody behavior and tantrums (Clarke et al., 2001a). This subgroup does respond to stimulant medication (Clarke et al., 2003). Family studies show that this is a familial pattern, and that it is associated with GABA-A receptors. This association may be related to the fact that benzodiazepines themselves produce a “Beta buzz” (Porjesz et al., 2002).
More recent work by Ogrim and Kropotov (2014, 2016, 2019) has consistently found that event-related potentials (ERPs) provide valuable predictive information. Specifically, attenuated pre-treatment P3 amplitude during a cued go-no-go task is predictive of positive behavioral response to methylphenidate or dexamphetamine stimulants. In a multivariate model combining spectral and ERP measures, higher cue P3, smaller no-go P3, and excess theta power were the strongest predictors of stimulant response, accounting for shared variance between measures. The contingent negative variation (CNV) has also been identified as a relevant measure, potentially serving as a dopaminergic biomarker given its responsiveness to stimulant medication.
Depression
The pharmaceutical treatment of depression is often characterized by trial and error, response failures, and combining drugs (Schatzberg, Cole, & DeBattista, 2010). Patients with depression are often given antidepressants or lithium, to which they may or may not respond. Indeed, at least one antidepressant is marketed specifically for patients whose first antidepressant is not sufficiently effective (Abilify, 2012). However, results are mixed, and choosing and maintaining an antidepressant can be an extended and difficult process. Negative side-effects and metabolic and physical damage are also an issue, and steps must be taken to avoid and manage these.
The significance of individual differences is clinically relevant to the diagnosis and treatment of depression. The inability to predict treatment response appears to be a considerable cost factor and source of failure. The STAR*D trial studied 3,671 patients receiving antidepressants as well as CBT. In this study, remission rates of 36.8% per treatment phase were seen, and 33% of patients were entirely treatment resistant, after 4 successive series of treatment (Rush et al., 2006). This was not a placebo controlled study, and involved primarily patients without health insurance. More recent estimates suggest that less than 30% of patients respond to the first antidepressant trial, with an estimated 67% ultimately entering remission after multiple treatment attempts. The timeline to recovery can span months to years, with significant personal and economic costs.
With regard to EEG correlates of depression, one prominent finding is that the Alpha wave power in the left and right dorsolateral frontal lobes is associated with overall mood. In order to sustain a positive mood, the Alpha power on the left is typically 10% to 20% lower than on the right. This reflects a differential activation of the hemispheres, which results in the individual emphasizing positive responses and approach behavior, which is mediated by the left hemisphere, in contrast to negative responses and withdrawal or avoidance behavior, which are mediated by the right hemisphere (Schaffer, Davidson & Saron, 1983; Henriques & Davidson, 1990).
Cook et al. (2002) used EEG absolute and relative power, and found a metric called cordance, that was able to identify medication responders, but only after 48 hours of using a trial medication. It did show that the frontal brain areas are likely involved in how a patient is responding to an antidepressant. Bruder et al. (2008) reported an explicit relationship between the amount of asymmetry in the Alpha wave, and how patients responded to SSRIs. In this study, 52 major-depressive disorder (MDD) patients were treated with fluoxetine for 12 weeks. Alpha asymmetry measurements differentiated responders from nonresponders (p < 0.005).
The International Study to Predict Optimized Treatment in Depression (iSPOT-D)
The iSPOT-D study represents the largest prospective trial to date examining EEG biomarkers for antidepressant response prediction. This multicenter, randomized, prospective open-label trial enrolled 1,008 patients with major depressive disorder across 22 sites in 5 countries (Australia, The Netherlands, New Zealand, South Africa, and the United States), randomizing participants to escitalopram (SSRI), sertraline (SSRI), or venlafaxine-extended release (SNRI). The study also recruited 336 healthy controls for comparison. Treatment response was established after eight weeks using the 17-item Hamilton Rating Scale for Depression, with response defined as 50% reduction in symptoms and remission defined as a score of 7 or below.
The study took an integrative neuroscience approach, examining biomarkers across structural and functional MRI, EEG, cognitive performance, and genomics in the same patients. This multimodal design enabled examination of convergence and complementarity across different measurement modalities. The comprehensive baseline assessment battery included resting-state EEG (eyes open and eyes closed), a cognitive testing battery covering attention, memory, and executive function, and structural and functional brain imaging.
Arns et al. (2016) examined EEG alpha asymmetry as a predictor of antidepressant outcome in the iSPOT-D sample. Notably, no differences in EEG alpha for occipital or frontal cortex, or for frontal alpha asymmetry (FAA), were found between MDD participants and controls at the group level. This negative finding for a presumed hallmark of depression was unexpected and contrasted with decades of prior research. The authors noted that this may reflect heterogeneity in the MDD population or methodological differences from earlier, smaller studies.
Alpha power in the occipital and frontal cortex was not associated with treatment outcome overall. However, a significant gender and drug-class interaction was identified: female SSRI responders showed greater right frontal alpha (indicating relative left hemisphere activation), while female SSRI non-responders showed the opposite pattern. This effect was not observed for males or for venlafaxine (SNRI), suggesting that frontal alpha asymmetry is a gender-specific and drug-class-specific predictor of SSRI response.
Van der Vinne et al. (2019) further examined the stability of frontal alpha asymmetry during treatment in a subset of 453 iSPOT-D participants who had both baseline and week-8 EEG assessments. They confirmed that FAA has trait-like properties, remaining stable regardless of treatment response, medication type, or changes in depressive symptoms. This stability supports its potential use as a baseline predictive marker but suggests that FAA does not track treatment-related changes in brain state.
Other iSPOT-D reports examined additional EEG markers. Arns et al. (2017) found that EEG abnormalities were associated with poorer depressive symptom outcomes with escitalopram and venlafaxine-XR, but not sertraline. Van Dinteren et al. (2015) examined the utility of event-related potentials in predicting antidepressant treatment response, finding that ERPs provided complementary information to resting-state EEG measures. These findings highlight that different EEG metrics may have differential predictive value for different medications, supporting the potential for personalized treatment selection.
The EMBARC Study and Machine Learning Approaches
The Establishing Moderators and Biosignatures of Antidepressant Response in Clinical Care (EMBARC) study represents another landmark neuroimaging-coupled randomized controlled trial in depression (Trivedi et al., 2016). This multicenter, double-blind, placebo-controlled trial randomized 309 patients with MDD to sertraline or placebo for eight weeks, with comprehensive baseline assessments including EEG and fMRI at four sites (Columbia University, University of Michigan, University of Texas Southwestern, and Massachusetts General Hospital). Non-responders to initial treatment were then rerandomized to bupropion or sertraline. The inclusion of a placebo arm distinguishes EMBARC from iSPOT-D and enables examination of biomarkers that distinguish drug response from placebo response.
Wu et al. (2020) developed a machine learning algorithm called SELSER (Sparse EEG Latent Space Regression) and applied it to resting-state EEG data from EMBARC. Using this approach, they identified an EEG signature at baseline that was uniquely associated with subsequent response to sertraline while not being associated with placebo response. Critically, this represented a methodological advance over prior work: demonstrating that an EEG biomarker can distinguish drug-specific response from non-specific factors captured in placebo response.
The sertraline-specific EEG signature was validated in an independent sample from a naturalistic longitudinal depression study involving various antidepressants. In this validation sample, the EEG signature was associated with antidepressant response and negatively correlated with the number of failed antidepressant trials, as would be expected from a biomarker of antidepressant responsiveness. Furthermore, the EEG signature showed convergence with fMRI measures of prefrontal neural responsivity to transcranial magnetic stimulation, supporting its neurobiological validity.
A recent analysis of EMBARC data using unsupervised machine learning (2025) identified four distinct response phenotypes based on EEG functional connectivity patterns analyzed with clustering algorithms. Drug-Responders (n=124) exhibited a large sertraline advantage over placebo (Cohen’s d=1.23, p<0.0001). Non-Responders (n=37) derived no benefit from sertraline compared to placebo (d=-0.07, p=0.84). Most intriguingly, the analysis identified a Divergent-Responder group that showed a distinctive connectivity profile. Within this group, participants randomized to placebo improved robustly (Placebo-Responders; n=54; d=-1.52, p<0.0001), whereas those receiving sertraline actually worsened (Adverse Drug-Responders; n=31; d=-0.67, p=0.004).
The identification of patients who worsen with antidepressant treatment has significant clinical implications. If these findings can be replicated and translated to clinical practice, EEG-based screening could potentially prevent harm from inappropriately prescribed medications. The effect of removing high placebo responders from clinical trials could also improve the ability to detect true drug effects, addressing a long-standing challenge in antidepressant drug development.
Deep learning approaches have shown particularly promising results. Using convolutional neural networks applied to source-localized EEG connectivity from EMBARC (using robust exact low-resolution electromagnetic tomography, ReLORETA, for source reconstruction and symbolic transfer entropy for connectivity), researchers achieved classification accuracies of 91.0%, 95.4%, and 86.8% for predicting response to sertraline, placebo, and bupropion, respectively. These accuracy levels substantially exceed those achieved with traditional band power analyses, though validation in independent clinical samples remains essential before clinical implementation.
Multimodal approaches combining EEG with fMRI have also been explored. Graph neural network frameworks integrating fMRI and EEG connectivity data have achieved improved prediction of treatment response compared to either modality alone. These approaches can identify brain network signatures that may have complementary predictive information, with EEG capturing temporal dynamics and functional state while fMRI provides spatial precision for localizing network nodes.
Meta-Analyses and Critical Evaluation of the Evidence
Several meta-analyses published since 2012 have provided sobering assessments of the current state of EEG biomarkers for treatment prediction. Widge et al. (2019) conducted a comprehensive meta-analysis of QEEG biomarkers for predicting depression treatment response, published in the American Journal of Psychiatry. The analysis examined studies of various biomarkers including alpha power, theta power, alpha asymmetry, cordance, loudness dependence of auditory evoked potentials (LDAEP), and the proprietary Antidepressant Treatment Response (ATR) index.
The meta-analysis reported modest overall predictive power with pooled sensitivity of 0.72 and specificity of 0.68, yielding an area under the receiver operating characteristic curve of 0.76. While statistically significant, these accuracy levels may have limited clinical utility given the costs and risks of misclassification. Critically, funnel plot analysis suggested that the apparent predictive power of QEEG was driven by small studies with strong positive results, with clear evidence of publication bias. The funnel plot was specifically depleted in studies with smaller effect sizes that may not have reached prespecified significance thresholds.
The authors identified several methodological concerns that limit interpretation of the literature. First, most studies did not report out-of-sample validation, instead reporting performance on the same data used to train the predictive model. This approach is known to substantially overestimate accuracy in independent samples. Second, there was insufficient direct replication of previous findings, with each research group typically developing proprietary biomarkers rather than validating previously reported markers. Third, the clinical heterogeneity in treatment protocols, outcome measures, and patient populations made comparison across studies difficult.
The meta-analysis concluded that “QEEG does not appear clinically reliable for predicting depression treatment response, as the literature is limited by underreporting of negative results, a lack of out-of-sample validation, and insufficient direct replication of previous findings. Until these limitations are remedied, QEEG is not recommended for guiding selection of psychiatric treatment.” This cautionary conclusion contrasts sharply with the more optimistic tone of earlier narrative reviews and highlights the gap between individual study findings and robust clinical utility.
A subsequent machine learning meta-analysis by Zhdanov et al. (2022) examined 15 studies using machine learning to predict treatment response in MDD. While pooled accuracy was higher than in traditional biomarker studies, the authors noted wide variation in important features across models. Relevant features included absolute and relative power in various frequency bands, connectivity measures, and hemispheric asymmetry, but no consistent pattern emerged across studies. They emphasized the need for prospective model validation in independent datasets and greater emphasis on replicating specific physiological markers rather than developing new models for each study.
The NeuroPharm study (Ip et al., 2021) attempted to independently validate previously suggested EEG biomarkers in a large prospective sample of 79 antidepressant-free MDD patients who completed an 8-week treatment protocol. Using methodology matched as closely as possible to prior studies (iSPOT-D, EMBARC), they examined frontal and occipital alpha power and asymmetry, and delta and theta activity at the anterior cingulate cortex. The study found only partial validation of previously reported biomarkers, with some effects replicating while others did not. This underscores the challenge of replicating EEG biomarker findings across different populations and methodological contexts, even when attempting to match procedures.
Cordance and the Antidepressant Treatment Response Index
Cordance, developed by Leuchter and colleagues, incorporates both absolute and relative power from frontal EEG electrodes and has been shown to have a stronger association with cerebral perfusion as measured by PET than either absolute or relative power alone (Leuchter et al., 1999). Changes in frontal midline and right frontal cordance within the first week of treatment have been proposed as early biomarkers of antidepressant response, potentially enabling identification of non-responders before the typical 4-6 week period required for clinical assessment.
The BRITE-MD study (Leuchter et al., 2009) examined cordance-based biomarkers for predicting response to SSRI treatment. The Antidepressant Treatment Response (ATR) index, a proprietary metric combining baseline and 1-week change in frontal alpha and theta activity, was developed and commercialized by Aspect Medical Systems (later acquired by Covidien). The ATR was reported to predict medication response after only one week of pharmacotherapy with approximately 74% overall accuracy.
However, subsequent independent validation studies have yielded mixed results. The Widge et al. (2019) meta-analysis noted that cordance and ATR-related biomarkers had not been independently validated by groups other than the original developers. An attempt to apply previously reported QEEG biomarkers, including cordance, to data from the rTMS OPT-TMS trial found no significant correlation between these biomarkers and clinical improvement (Widge et al., 2013). The authors cautioned that “some previously reported QEEG biomarkers of antidepressant response may not generalize to patients undergoing rTMS,” though they acknowledged that biomarkers derived from medication trials may not apply to neuromodulation treatments with different mechanisms of action.
Precision Psychiatry and Future Directions
The concept of precision psychiatry has emerged as a guiding framework for biomarker development in mental health. This approach seeks to optimize psychiatric patient care by better predicting which individuals will develop an illness, providing more accurate biologically-based diagnoses, and utilizing more effective treatments based on individual biological characteristics (Fernandes et al., 2017). EEG represents an attractive modality for precision psychiatry applications due to its non-invasive nature, relatively low cost (compared to MRI or PET), excellent temporal resolution enabling capture of rapid neural dynamics, and scalability for clinical implementation in diverse settings.
Recent developments in wearable EEG technology have expanded possibilities for continuous monitoring and ecological assessment. Devices such as the Dreem headband enable EEG recording during sleep with consumer-grade hardware. Companies such as Beacon Biosignals have developed platforms for analyzing EEG data collected during sleep, with applications in tracking treatment response over time and identifying pharmacodynamic biomarkers that may precede clinical improvement. The ability to collect longitudinal EEG data in naturalistic settings could overcome limitations of single-session laboratory assessments and capture day-to-day variability in brain function.
Alto Neuroscience has pursued an integrated approach combining EEG biomarkers with novel drug development. Their strategy involves identifying patients likely to respond to specific mechanisms of action based on pre-treatment brain function measures, then developing drugs targeting those mechanisms. As of 2024, the company has five novel drug candidates in Phase II clinical trials for psychiatric conditions, each paired with EEG-based patient selection algorithms. This biomarker-guided drug development approach represents a shift from traditional trial-and-error prescribing toward mechanism-matched treatment selection.
The concept of neurotyping has emerged as a method to biotype patients based on functional brain biomarkers. By identifying distinct neural signatures associated with depression or ADHD subtypes using event-related potentials and other EEG-derived measures, neurotyping could enable more precise treatment selection. This approach recognizes that diagnostic categories like “major depressive disorder” or “ADHD” likely encompass multiple subtypes with different underlying neurobiological mechanisms and optimal treatment strategies. Rather than treating diagnosis as a homogeneous entity, neurotyping seeks to identify biologically meaningful patient subgroups.
The integration of EEG with other biomarker modalities represents a promising direction for improving prediction accuracy. Multimodal approaches combining EEG with genomics, proteomics, cognitive testing, and other neuroimaging may provide more robust prediction than any single modality alone. Spronk et al. (2011) demonstrated that the best predictors of antidepressant response combined genetic markers (COMT Met/Met variant), cognitive measures (verbal memory performance), and EEG features (frontal theta power). More recent work has applied graph neural networks to integrate fMRI and EEG connectivity data, achieving improved prediction of treatment response compared to either modality alone.
Current Limitations and Challenges
Despite significant progress, substantial challenges remain before EEG biomarkers can be widely implemented in clinical practice. First, replication has proven difficult across the field. Findings from single-site studies often fail to replicate in larger, multicenter trials with more diverse patient populations. The iSPOT-A finding that theta/beta ratio did not differ between ADHD and controls, and did not predict treatment response, contradicted decades of prior research from smaller studies. Similarly, the NeuroPharm validation study found only partial support for previously reported depression biomarkers, even when attempting to closely match prior methodology.
Second, there is a lack of standardization in EEG acquisition, preprocessing, and analysis methods across studies. Differences in electrode configurations (ranging from single-electrode to high-density arrays), reference schemes (average reference, linked mastoids, Cz reference), artifact rejection procedures, and frequency band definitions make it difficult to compare results across studies. The field would benefit from consensus guidelines for EEG biomarker studies in psychiatry, similar to standards that exist for clinical EEG in epilepsy.
Third, most biomarker studies have examined prediction of response to a single medication or class, but clinical decision-making typically involves choosing among multiple options. Few studies have examined whether EEG can guide differential treatment selection—predicting that a patient will respond to drug A but not drug B. The EMBARC machine learning analysis identifying patients who respond to placebo but worsen with sertraline represents an important step in this direction, but prospective trials randomizing patients to different treatments based on EEG biomarkers are needed to establish clinical utility.
Fourth, the relationship between statistical prediction and clinical utility remains unclear. A biomarker that achieves 70% accuracy in predicting response may be statistically significant but of limited clinical value if it does not substantially improve outcomes beyond current practice. Importantly, no published studies have demonstrated that biomarker-guided treatment selection actually improves patient outcomes compared with standard care. Cost-effectiveness analyses comparing biomarker-guided treatment to treatment-as-usual are also needed before routine clinical implementation can be justified.
Fifth, access to EEG remains limited in many clinical settings. While EEG is relatively inexpensive compared to MRI, it requires specialized equipment, trained technicians, and expertise in interpretation that may not be available in primary care or community mental health settings where most psychiatric treatment occurs. The development of simplified, automated, and portable EEG assessment systems could address this barrier, but such systems require extensive validation before clinical deployment.
Clinical Applications and Practice Implications
Despite the limitations noted above, several findings have sufficient support to inform clinical practice on a case-by-case basis. First, patients with clearly elevated theta activity in frontal regions, particularly those meeting criteria for the “frontal slow” EEG phenotype, appear more likely to respond to stimulant medication. This relationship has been replicated across multiple studies spanning several decades and makes physiological sense given the activating effects of stimulants on prefrontal cortex. For a patient with ADHD who shows clear frontal slowing on EEG, stimulant medication may be a reasonable first-line treatment choice.
Second, individual alpha peak frequency (iAPF) has emerged as one of the more robust predictors across conditions. Low iAPF is associated with non-response to both stimulants in ADHD and antidepressants in depression. As Arns et al. (2018) recommend, quantitative EEG analysis should clearly distinguish between slowing of the anterior peak frequency and the presence of frontal slow waves, which may appear similar in traditional band power analyses but have different functional and prognostic implications. Patients with notably slow alpha peak frequency (below 8 Hz in adults) may be at higher risk for treatment non-response and could benefit from closer monitoring or consideration of alternative approaches.
Third, EEG may have particular value in identifying non-responders or those prone to adverse reactions. The EMBARC analysis identifying patients who worsen with sertraline suggests that EEG could potentially be used to avoid harmful treatments in susceptible individuals. Given the significant costs and risks of ineffective treatment trials—including side effects, demoralization, delayed recovery, and healthcare costs—biomarkers that identify likely non-responders may have high clinical utility even if they cannot definitively identify responders.
Fourth, EEG can be used as an objective measure to monitor treatment progress and guide adjustments. Changes in frontal theta activity, alpha peak frequency, or aperiodic slope during the early weeks of treatment may provide early indicators of treatment response before clinical symptoms improve. This could enable earlier identification of non-responders who might benefit from medication changes, dosage adjustments, or augmentation strategies.
For practicing clinicians, the key questions that will remain are how (or if) this approach will affect or fit into the role of the mental health counselor. Currently, thousands of mental health counselors practice biofeedback or EEG biofeedback (neurofeedback) as part of their licensure and certifications. It is not unusual for an experienced practitioner, be they a social worker, psychologist, or counselor, to take a full-head QEEG, and have it evaluated. Even a 1, 2, or 4-channel EEG can provide information relevant to medication prediction, such as the amount of global frontal Theta, the Theta/Beta ratio, or individual alpha peak frequency. These measures can also be used to monitor drug effectiveness and progress, providing objective data to complement clinical observation. The role of the ancillary mental health community could incorporate EEG, QEEG, and biofeedback in concert with, rather than as opposed to, medication.
Conclusion
The results described here make a case for continued consideration of EEG as an important factor in assessing patients with ADD/ADHD or depression. The parameters available from EEG as well as QEEG analysis provide a foundation for improving psychopharmacological management, avoiding treatment failures, and assessing treatment progress. It is found that certain underlying factors visible in the EEG can predict drug response and indicate potentially useful medications, beyond what is possible with behavioral or cognitive assessments alone. For example, in a group of non-responders to antidepressants, studies have shown that the subgroup with excess Theta power may respond well to stimulant medication, despite there being no diagnosis of ADHD.
However, the evidence base since 2012 has provided a more nuanced and cautious perspective than earlier enthusiasm suggested. Meta-analyses have revealed significant methodological limitations in the field, including publication bias, lack of independent replication, and insufficient out-of-sample validation. Large-scale clinical trials such as iSPOT-D and iSPOT-A have failed to replicate some earlier findings, particularly regarding the theta/beta ratio as a diagnostic or prognostic marker. The FDA approval of NEBA for ADHD assessment was followed by professional guidelines from the American Academy of Neurology recommending against its clinical use outside research settings.
At the same time, several developments provide grounds for cautious optimism. Machine learning approaches have achieved substantially higher prediction accuracy than traditional band power analyses, and the ability to distinguish drug response from placebo response—as demonstrated with the SELSER algorithm in EMBARC—represents a critical methodological advance. The EMBARC dataset has enabled discovery of clinically meaningful patient subtypes, including identification of patients who may actually be harmed by standard antidepressant treatments. New biomarker concepts such as aperiodic activity, EEG connectivity, and individual alpha peak frequency offer fresh approaches that may be more robust than traditional theta/beta ratio measures.
The field of precision psychiatry provides a conceptual framework for future development. The goal is not simply to predict average response to treatment, but to match individual patients with the treatments most likely to help them and avoid treatments most likely to harm them. This requires moving beyond single biomarkers to multivariate, multimodal approaches that capture the complexity and heterogeneity of psychiatric disorders. EEG, with its advantages of low cost, non-invasiveness, excellent temporal resolution, and portability, is well-positioned to contribute to this vision.
If the current limitations with regard to replication, standardization, and demonstration of clinical utility can be surmounted, EEG-based biomarkers could become a valuable addition to pharmacological planning and evaluation. The next decade will likely see continued development of machine learning approaches applied to larger datasets, prospective validation trials with biomarker-guided randomization, and integration of EEG with other biomarker modalities including genetics, blood-based markers, and advanced neuroimaging. Regulatory pathways for psychiatric biomarkers are evolving, potentially enabling approval of validated prediction tools.
For now, EEG biomarkers remain most appropriately used as one source of information among many, to be integrated with clinical judgment rather than replacing it. A prudent approach would be to consider EEG findings alongside clinical presentation, patient history, and preferences when making treatment decisions. Clinicians who incorporate QEEG into their practice should be aware of both the potential value and the current limitations of this approach. Overall, the potential of EEG as a means to determine optimal medications is a promising one, and warrants continued research and cautious clinical application.
References
American Academy of Neurology. (2016). Practice advisory: The utility of EEG theta/beta power ratio in ADHD diagnosis. Neurology, 87(22), 2375-2379.
Arns, M., Conners, C. K., & Kraemer, H. C. (2013). A decade of EEG theta/beta ratio research in ADHD: A meta-analysis. Journal of Attention Disorders, 17(5), 374-383.
Arns, M., Bruder, G., Hegerl, U., Spooner, C., Palmer, D. M., Etkin, A., … & Gordon, E. (2016). EEG alpha asymmetry as a gender-specific predictor of outcome to acute treatment with different antidepressant medications in the randomized iSPOT-D study. Clinical Neurophysiology, 127(1), 509-519.
Arns, M., Vollebregt, M. A., Palmer, D., Spooner, C., Gordon, E., Kohn, M., … & Williams, L. M. (2018). Electroencephalographic biomarkers as predictors of methylphenidate response in ADHD. European Neuropsychopharmacology, 28(8), 881-891.
Arns, M., Gunkelman, J., Breteler, M., & Spronk, D. (2008). EEG phenotypes predict treatment outcome to stimulants in children with ADHD. Journal of Integrative Neuroscience, 7(3), 421-438.
Bruder, G. E., Sedoruk, J. P., Stewart, J. W., McGrath, P. J., Quitkin, F. M., & Tenke, C. E. (2008). Electroencephalographic alpha measures predict therapeutic response to SSRI antidepressant. Biological Psychiatry, 63(12), 1171-1177.
Chabot, R. J. & Serfontein, G. (1996). Quantitative electroencephalographic profiles of children with attention deficit disorder. Biological Psychiatry, 40(10), 951-963.
Cook, I. A., Leuchter, A. F., Morgan, M., Witte, E., Stubbeman, W. F., Abrams, M., … & Leuchter, A. F. (2002). Early changes in prefrontal activity characterize clinical responders to antidepressants. Neuropsychopharmacology, 27(1), 120-131.
Donoghue, T., Haller, M., Peterson, E. J., Varma, P., Sebastian, P., Gao, R., … & Voytek, B. (2020). Parameterizing neural power spectra into periodic and aperiodic components. Nature Neuroscience, 23(12), 1655-1665.
Gloss, D., Varma, J. K., Pringsheim, T., & Nuwer, M. R. (2016). Practice advisory: The utility of EEG theta/beta power ratio in ADHD diagnosis. Neurology, 87(22), 2375-2379.
Henriques, J. B. & Davidson, R. J. (1990). Regional brain electrical asymmetries discriminate between previously depressed and healthy control subjects. Journal of Abnormal Psychology, 99(1), 22-31.
Hermens, D. F., Rowe, D. L., Gordon, E., & Williams, L. M. (2006). Integrative neuroscience approach to predict ADHD stimulant response. Expert Review of Neurotherapeutics, 6(5), 753-763.
Ip, C. T., Ganz, M., Dam, V. H., Ozenne, B., Kohler-Forsberg, K., Jorgensen, M. B., … & Frokjaer, V. G. (2021). Pretreatment qEEG biomarkers for predicting pharmacological treatment outcome in major depressive disorder. European Neuropsychopharmacology, 49, 101-112.
Lansbergen, M., Arns, M., van Dongen-Boomsma, M., Spronk, D., & Buitelaar, J. K. (2011). The increase in theta/beta ratio on resting state EEG is mediated by slow alpha peak frequency. Progress in Neuro-Psychopharmacology & Biological Psychiatry, 35, 47-52.
Leuchter, A. F., Cook, I. A., Marangell, L. B., Gilmer, W. S., Burgoyne, K. S., Howland, R. H., … & Husain, M. M. (2009). Comparative effectiveness of biomarkers and clinical indicators for predicting outcomes of SSRI treatment in MDD. Psychiatry Research, 169(2), 124-131.
Lubar, J. F. (1991). Discourse on the development of EEG diagnostics and biofeedback for attention-deficit/hyperactivity disorders. Applied Psychophysiology and Biofeedback, 16(3), 201-225.
Michelini, G., Norman, L. J., Shaw, P., & Loo, S. K. (2022). Treatment biomarkers for ADHD: Taking stock and moving forward. Translational Psychiatry, 12(1), 444.
Ogrim, G., & Kropotov, J. D. (2019). Predicting methylphenidate response in ADHD using ERP and QEEG indices. Clinical EEG and Neuroscience, 50(1), 34-43.
Ostlund, B. D., Alperin, B. R., Drew, T., & Karalunas, S. L. (2021). Behavioral and cognitive correlates of the aperiodic exponent in adolescents with and without ADHD. Developmental Cognitive Neuroscience, 48, 100931.
Robertson, M. M., Furlong, S., Voytek, B., Donoghue, T., Boettiger, C. A., & Sheridan, M. A. (2019). EEG power spectral slope differs by ADHD status and stimulant medication exposure in early childhood. Journal of Neurophysiology, 122(6), 2427-2437.
Rush, A. J., Trivedi, M. H., Wisniewski, S. R., Nierenberg, A. A., Stewart, J. W., Warden, D., … & Fava, M. (2006). Acute and longer-term outcomes in depressed outpatients requiring one or several treatment steps: A STAR*D report. American Journal of Psychiatry, 163(11), 1905-1917.
Snyder, S. M., Rugino, T. A., Hornig, M., & Stein, M. A. (2015). Integration of an EEG biomarker with a clinician’s ADHD evaluation. Brain and Behavior, 5(4), e00330.
Spronk, D., Arns, M., Barnett, K. J., Cooper, N. J., & Gordon, E. (2011). An investigation of EEG, genetic and cognitive markers of treatment response to antidepressant medication in MDD. Journal of Affective Disorders, 128, 41-48.
Sterman, M. B. (1996). Physiological origins and functional correlates of EEG rhythmic activities: Implications for self-regulation. Biofeedback and Self-Regulation, 21(1), 3-33.
Swanson, J. M., Hinshaw, S. P., Arnold, L. E., Gibbons, R. D., Marcus, S., Hur, K., … & Wigal, T. (2007). Secondary evaluations of MTA 36-month outcomes. Journal of the American Academy of Child & Adolescent Psychiatry, 46(8), 1003-1014.
Trivedi, M. H., McGrath, P. J., Fava, M., Parsey, R. V., Kurian, B. T., Phillips, M. L., … & Weissman, M. M. (2016). Establishing moderators and biosignatures of antidepressant response in clinical care (EMBARC). Journal of Psychiatric Research, 78, 11-23.
van der Vinne, N., Vollebregt, M. A., van Putten, M. J., & Arns, M. (2019). Stability of frontal alpha asymmetry in depressed patients during antidepressant treatment. NeuroImage: Clinical, 24, 102056.
Widge, A. S., Bilge, M. T., Montana, R., Chang, W., Rodriguez, C. I., Deckersbach, T., … & Dougherty, D. D. (2019). Electroencephalographic biomarkers for treatment response prediction in major depressive illness: A meta-analysis. American Journal of Psychiatry, 176(1), 44-56.
Williams, L. M., Rush, A. J., Koslow, S. H., Wisniewski, S. R., Cooper, N. J., Nemeroff, C. B., … & Gordon, E. (2011). International Study to Predict Optimized Treatment for Depression (iSPOT-D). Trials, 12, 4.
Wu, W., Zhang, Y., Jiang, J., Lucas, M. V., Fonzo, G. A., Rolle, C. E., … & Etkin, A. (2020). An electroencephalographic signature predicts antidepressant response in major depression. Nature Biotechnology, 38(4), 439-447.
Zhdanov, A., Atluri, S., Wong, W., Dhami, P., Bhattacharya, B. S., & Bhui, K. (2022). Predicting treatment response using EEG in major depressive disorder: A machine-learning meta-analysis. Translational Psychiatry, 12(1), 332.
Tom Collura
Ph.D., MSMHC, QEEG-D, BCN, NCC, LPCC-S, Founder
EEG as a Predictor of Medication Response – Updated December 2025
EEG as a Predictor of Medication Response:An Updated Review and...
Read More
Advances in EEG Analysis – Homomorphic Deconvolution of EEG using ICA and sLORETA
We have implemented a system that performs homomorphic deconvolution of...
Read More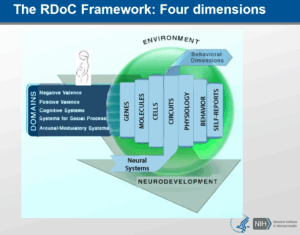
Symptoms, Disorders, Functions, and the NIH Research Domain Criteria
Symptoms, Disorders, Functions, and the NIH Research Domain Criteria There...
Read More